EXHIBIT 99.3
Published on June 22, 2021
Exhibit 99.3

INVESTOR PRESENTATION June 2021
2 DISCLAIMER This document includes statements that are, or may be deemed to be, “forward - looking statements” within the meaning of Section 2 7A of the Securities Act of 1933, as amended, and Section 21E of the Securities Exchange Act of 1934, as amended, which are intended to be covered by the safe harbors created by those laws. These forward - looking statements include information about pos sible or assumed future results of our operations. All statements, other than statements of historical facts, that address ac tiv ities, events or developments that we expect or anticipate may occur in the future, including such things as our outlook, our produc t d evelopment and planning, our pipeline, future capital expenditures, financial results, the impact of regulatory changes, exis tin g and evolving business strategies and acquisitions and dispositions, demand for our services and competitive strengths, goals, the be nefits of new initiatives, growth of our business and operations, our ability to successfully implement our plans, strategies , o bjectives, expectations and intentions are forward - looking statements. Also, when we use words such as “may,” “will,” “would,” “anticipate, ” “believe,” “estimate,” “expect,” “intend,” “plan,” “projects,” “forecasts,” “seeks,” “outlook,” “target,” goals,” “probably ,” or similar expressions, we are making forward - looking statements. Such statements are based upon the current beliefs and expectations of Sk illsoft’s management and are subject to significant risks and uncertainties. Actual results may differ from those set forth i n t he forward - looking statements. All forward - looking disclosure is speculative by its nature. There are important risks, uncertainties, events and factors that could cause our actual results or performance to differ mat eri ally from those in the forward - looking statements contained in this document, including: failure to realize the benefits expected from the business combination; the impact of changes in consumer spending patterns, consumer preferences, local, regional and national economic conditions, cri me, weather, demographic trends and employee availability; the impact of the ongoing COVID - 19 pandemic on our business, operating results and financial condition; fluctuations in our future operating results; our ability to successfully identify and consummate acquisition opportunities; the demand for, and acceptance of, our products and for cloud - based technology learning solutions in general; our ability to compete successfully in competitive markets and changes in the competitive environment in our industry and the ma rkets in which we operate; our ability to market existing products and develop new products; a failure of our information technology infrastructure or any significant breach of security; the effects of pending and future legislation; future regulatory, judicial and legislative changes in our industry; the impact of natural disasters, public health crises, political crises, or other catastrophic events; our ability to attract and retain key employees and qualified technical and sales personnel; fluctuations in foreign currency exchange rates; our ability to protect or obtain intellectual property rights; our ability to raise additional capital; the impact of our indebtedness on our financial position and operating flexibility; and our ability to successfully defend ourselves in legal proceedings. The foregoing list of factors is not exhaustive and new factors may emerge from time to time that could also affect actual pe rfo rmance and results. For more information, please see the risk factors included in Churchill Capital Corp. II’s Annual Report on Form 10 - K/A for the year ended December 31, 2020 in Part I, Item 1A and in the registration statement on Form S - 4 filed by Churchill Cap ital Corp. II and declared effective by the Securities and Exchange Commission (the “SEC”) on May 27, 2021, and subsequent fi lin gs with the SEC. Although we believe that the assumptions underlying our forward - looking statements are reasonable, any of these assumptions, and therefore also the forward - looking statements based on these assumptions, could themselves prove to be inaccurate. Given the significant uncertainties inherent in the forward - looking statements included in this document, our inclusion of this informatio n is not a representation or guarantee by us that our objectives and plans will be achieved. Annualized, pro forma, projecte d a nd estimated numbers are used for illustrative purpose only, are not forecasts and may not reflect actual results. Our forward - looking statements speak only as of the date made and we will not update these forward - looking statements unless req uired by applicable law. With regard to these risks, uncertainties and assumptions, the forward - looking events discussed in this document may not occur, and we caution you against unduly relying on these forward - looking statements.

Introduction Strategy Finance Q&A INTRODUCTION 3
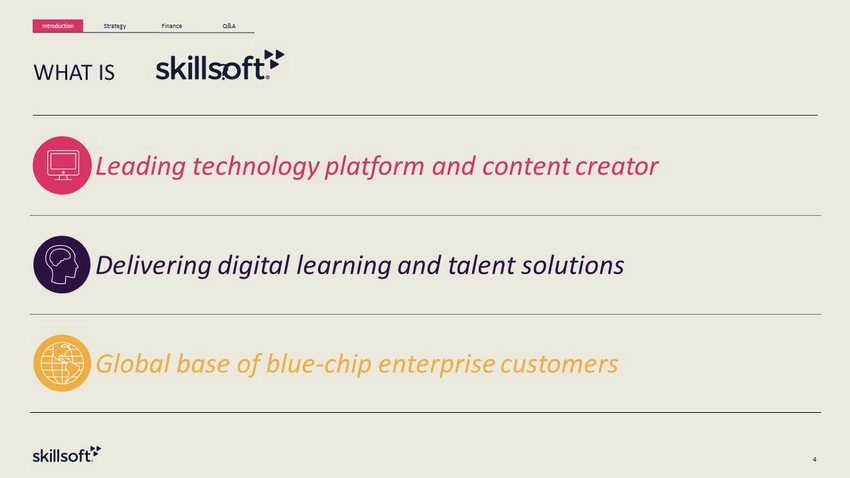
Introduction Strategy Finance Q&A 4 Leading technology platform and content creator Delivering digital learning and talent solutions Global base of blue - chip enterprise customers WHAT IS ?
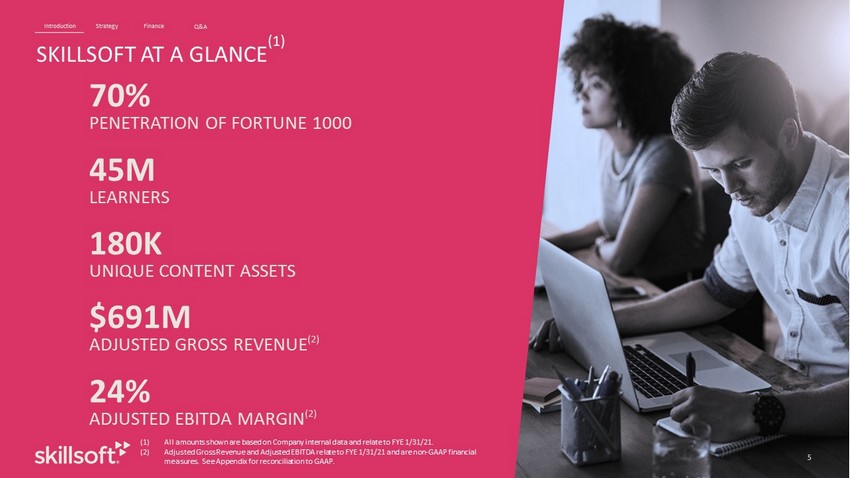
5 Strategy Finance Q&A Introduction 70% PENETRATION OF FORTUNE 1000 45M LEARNERS 180K UNIQUE CONTENT ASSETS $691M ADJUSTED GROSS REVENUE (2) 24% ADJUSTED EBITDA MARGIN (2) 5 SKILLSOFT AT A GLANCE (1) (1) All amounts shown are based on Company internal data and relate to FYE 1/31/21. (2) Adjusted Gross Revenue and Adjusted EBITDA relate to FYE 1/31/21 and are non - GAAP financial measures. See Appendix for reconciliation to GAAP.
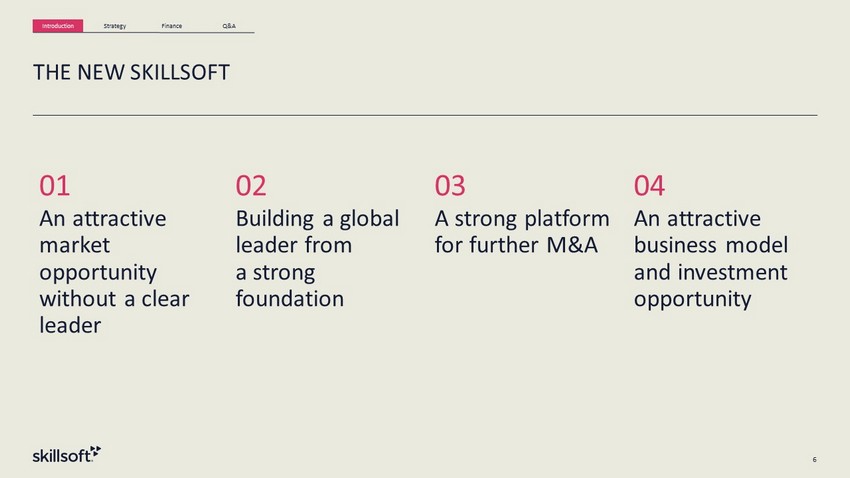
Introduction Strategy Finance Q&A 6 THE NEW SKILLSOFT 01 An attractive market opportunity without a clear leader 02 Building a global leader from a strong foundation 03 A strong platform for further M&A 04 An attractive business model and investment opportunity
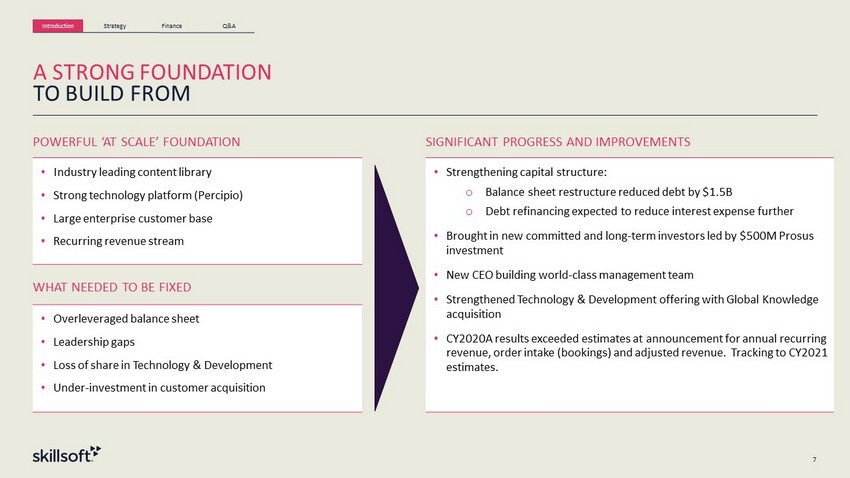
Introduction Strategy Finance Q&A POWERFUL ‘AT SCALE’ FOUNDATION SIGNIFICANT PROGRESS AND IMPROVEMENTS • Industry leading content library • Strong technology platform ( Percipio ) • Large enterprise customer base • Recurring revenue stream • Strengthening capital structure: o Balance sheet restructure reduced debt by $1.5B o Debt refinancing expected to reduce interest expense further • Brought in new committed and long - term investors led by $500M Prosus investment • New CEO building world - class management team • Strengthened Technology & Development offering with Global Knowledge acquisition • CY2020A results exceeded estimates at announcement for annual recurring revenue, order intake (bookings) and adjusted revenue. Tracking to CY2021 estimates. WHAT NEEDED TO BE FIXED • Overleveraged balance sheet • Leadership gaps • Loss of share in Technology & Development • Under - investment in customer acquisition 7 A STRONG FOUNDATION TO BUILD FROM
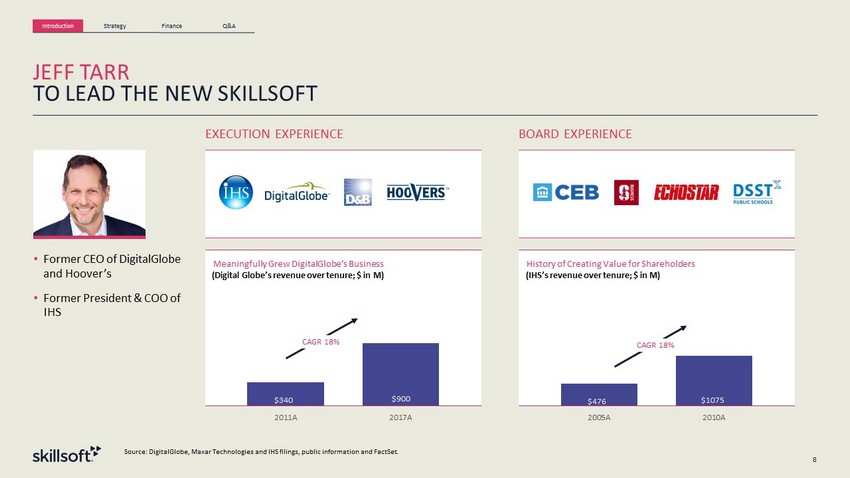
Introduction Strategy Finance Q&A 8 JEFF TARR TO LEAD THE NEW SKILLSOFT History of Creating Value for Shareholders (IHS’s Revenue Over Tenure; $ in millions) $ 476 $ 1075 2005A 2010A Meaningfully Grew DigitalGlobe’s Business ( DigitalGlobe’s revenue over tenure; $ in millions) $ 340 $ 900 2011A 2017A BOARD EXPERIENCE EXECUTION EXPERIENCE • Former CEO of DigitalGlobe and Hoover’s • Former President & COO of IHS CAGR 18% (IHS’s revenue over tenure; $ in M) (Digital Globe’s revenue over tenure; $ in M) CAGR 18% Source: DigitalGlobe , Maxar Technologies and IHS filings, public information and FactSet.
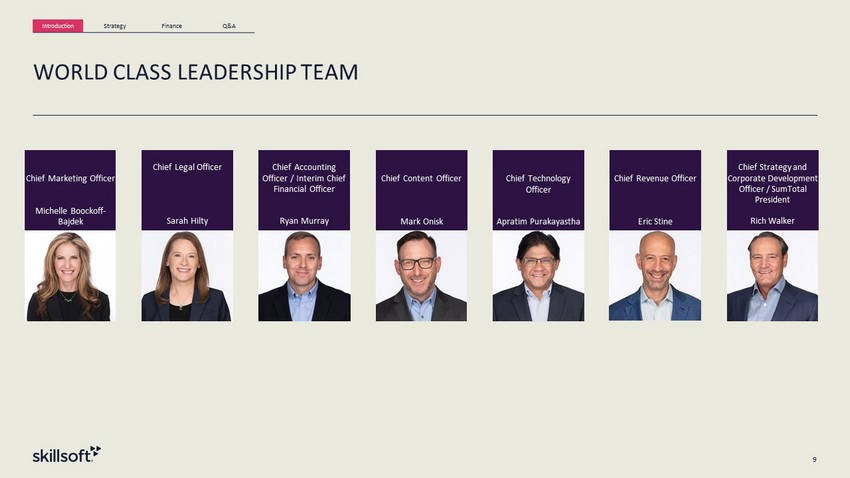
Introduction Strategy Finance Q&A 9 WORLD CLASS LEADERSHIP TEAM Chief Content Officer Mark Onisk Chief Marketing Officer Michelle Boockoff - Bajdek Chief Legal Officer Sarah Hilty Chief Accounting Officer / Interim Chief Financial Officer Ryan Murray Chief Strategy and Corporate Development Officer / SumTotal President Rich Walker Chief Technology Officer Apratim Purakayastha Chief Revenue Officer Eric Stine
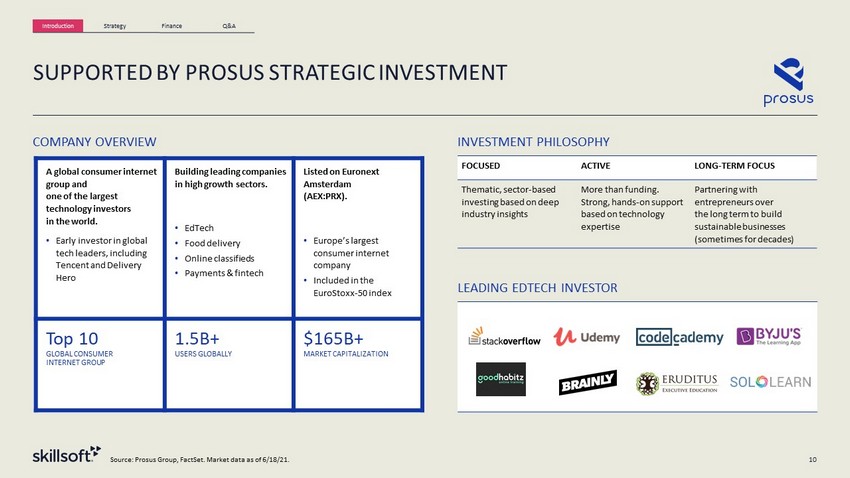
Introduction Strategy Finance Q&A 10 A global consumer internet group and one of the largest technology investors in the world. • Early investor in global tech leaders, including Tencent and Delivery Hero Building leading companies in high growth sectors. • EdTech • Food delivery • Online classifieds • Payments & fintech Listed on Euronext Amsterdam (AEX:PRX). • Europe’s largest consumer internet company • Included in the EuroStoxx - 50 index Top 10 GLOBAL CONSUMER INTERNET GROUP 1.5B+ USERS GLOBALLY $ 165B+ MARKET CAPITALIZATION INVESTMENT PHILOSOPHY FOCUSED ACTIVE LONG - TERM FOCUS Thematic, sector - based investing based on deep industry insights More than funding. Strong, hands - on support based on technology expertise Partnering with entrepreneurs over the long term to build sustainable businesses (sometimes for decades) SUPPORTED BY PROSUS STRATEGIC INVESTMENT Source: Prosus Group, FactSet. Market data as of 6/18/21. COMPANY OVERVIEW LEADING EDTECH INVESTOR
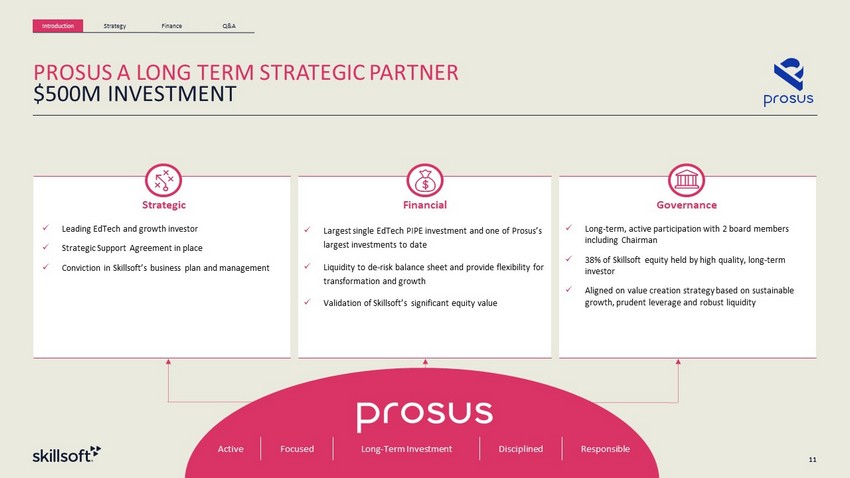
Introduction Strategy Finance Q&A 11 PROSUS A LONG TERM STRATEGIC PARTNER $500M INVESTMENT 11 Governance Strategic x Leading EdTech and growth investor x Strategic Support Agreement in place x Conviction in Skillsoft’s business plan and management Financial x Largest single EdTech PIPE investment and one of Prosus’s largest investments to date x Liquidity to de - risk balance sheet and provide flexibility for transformation and growth x Validation of Skillsoft’s significant equity value x Long - term, active participation with 2 board members including Chairman x 38% of Skillsoft equity held by high quality, long - term investor x A ligned on value creation strategy based on sustainable growth, prudent leverage and robust liquidity Active Focused Long - Term Investment Disciplined Responsible

Introduction Strategy Finance Q&A STRATEGY 12
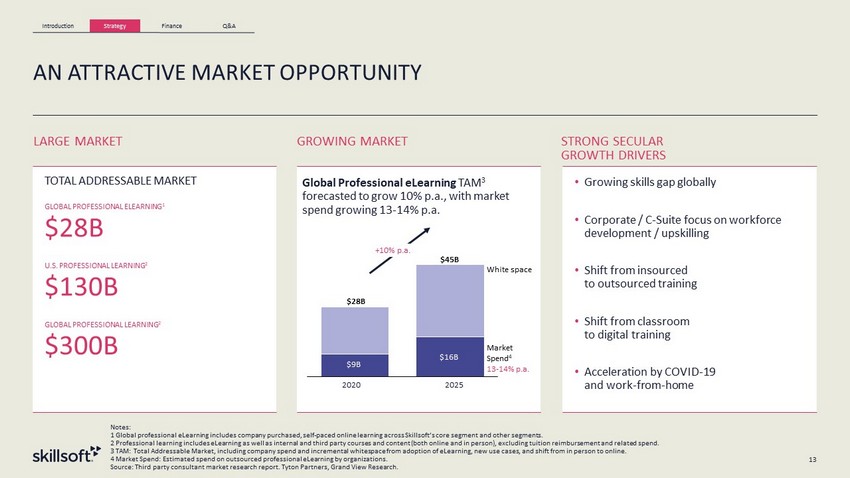
Introduction Strategy Finance Q&A AN ATTRACTIVE MARKET OPPORTUNITY LARGE MARKET GROWING MARKET STRONG SECULAR GROWTH DRIVERS • Growing skills gap globally • Corporate / C - Suite focus on workforce development / upskilling • Shift from insourced to outsourced training • Shift from classroom to digital training • Acceleration by COVID - 19 and work - from - home TOTAL ADDRESSABLE MARKET GLOBAL PROFESSIONAL ELEARNING 1 $ 28B U.S. PROFESSIONAL LEARNING 2 $ 130B GLOBAL PROFESSIONAL LEARNING 2 $ 300B Global Professional eLearning TAM 3 forecasted to grow 10% p.a., with market spend growing 13 - 14% p.a. $9B $16B 2020 2025 +10% p.a. Notes: 1 Global professional eLearning includes company purchased, self - paced online learning across Skillsoft’s core segment and other segments. 2 Professional learning includes eLearning as well as internal and third party courses and content (both online and in person ), excluding tuition reimbursement and related spend. 3 TAM: Total Addressable Market, including company spend and incremental whitespace from adoption of eLearning, new use cases , a nd shift from in person to online. 4 Market Spend: Estimated spend on outsourced professional eLearning by organizations. Source: Third party consultant market research report. Tyton Partners, Grand View Research. 13 White space Market Spend 4 13 - 14% p.a. $28B $45B
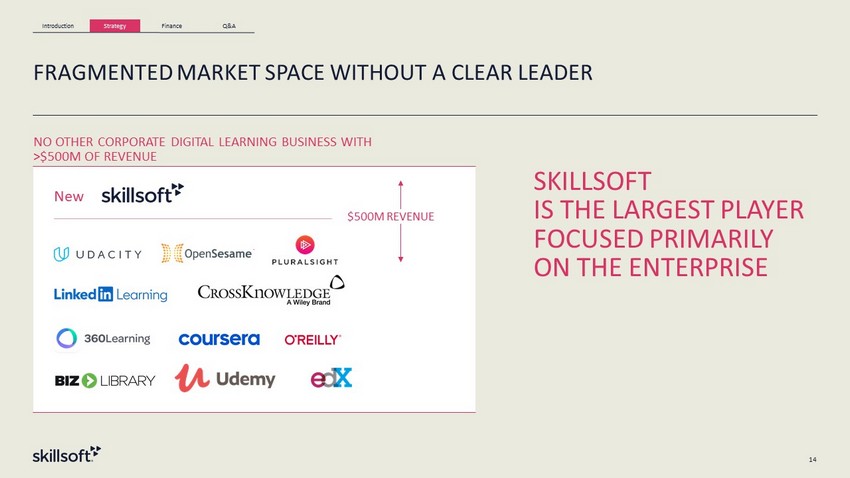
Introduction Strategy Finance Q&A 14 FRAGMENTED MARKET SPACE WITHOUT A CLEAR LEADER SKILLSOFT IS THE LARGEST PLAYER FOCUSED PRIMARILY ON THE ENTERPRISE NO OTHER CORPORATE DIGITAL LEARNING BUSINESS WITH >$500M OF REVENUE New $500M REVENUE
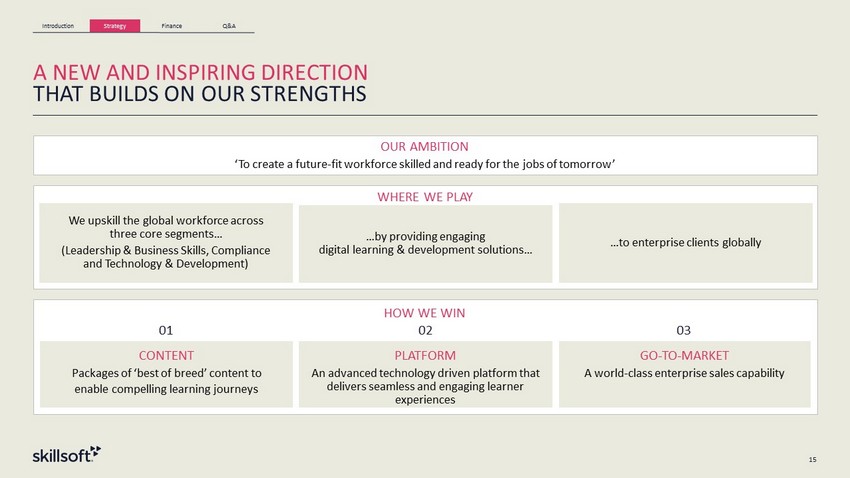
Introduction Strategy Finance Q&A A NEW AND INSPIRING DIRECTION THAT BUILDS ON OUR STRENGTHS 15 WHERE WE PLAY We upskill the global workforce across three core segments… (Leadership & Business Skills, Compliance and Technology & Development) …by providing engaging digital learning & development solutions… …to enterprise clients globally OUR AMBITION ‘To create a future - fit workforce skilled and ready for the jobs of tomorrow’ HOW WE WIN CONTENT Packages of ‘best of breed’ content to enable compelling learning journeys PLATFORM An advanced technology driven platform that delivers seamless and engaging learner experiences GO - TO - MARKET A world - class enterprise sales capability 01 02 03
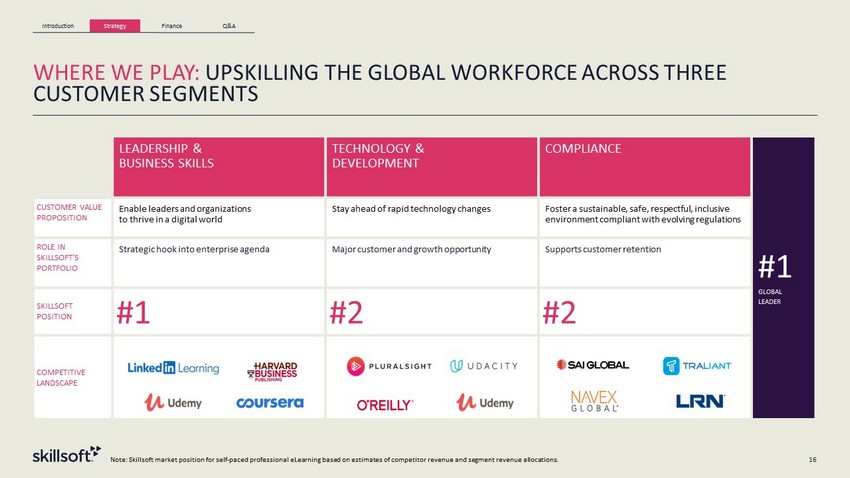
Introduction Strategy Finance Q&A 16 WHERE WE PLAY: UPSKILLING THE GLOBAL WORKFORCE ACROSS THREE CUSTOMER SEGMENTS LEADERSHIP & BUSINESS SKILLS TECHNOLOGY & DEVELOPMENT COMPLIANCE # 1 G L OBAL LEADER CUSTOMER VALUE PROPOSITION Enable leaders and organizations to thrive in a digital world Stay ahead of rapid technology changes Foster a sustainable, safe, respectful, inclusive environment compliant with evolving regulations ROLE IN SKILLSOFT’S PORTFOLIO Strategic hook into enterprise agenda Major customer and growth opportunity Supports customer retention SKILLSOFT POSITION # 1 # 2 # 2 COMPETITIVE LANDSCAPE Note: Skillsoft market position for self - paced professional eLearning based on estimates of competitor revenue and segment revenue all ocations.
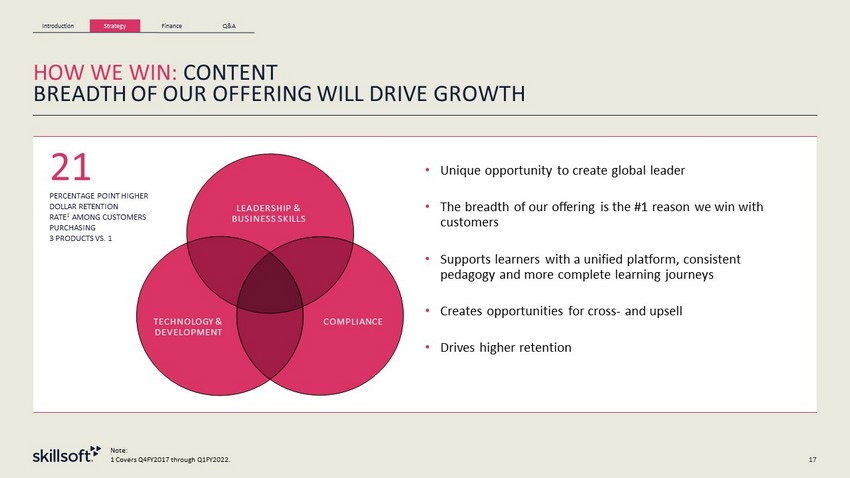
Introduction Strategy Finance Q&A 17 HOW WE WIN: CONTENT BREADTH OF OUR OFFERING WILL DRIVE GROWTH • Unique opportunity to create global leader • The breadth of our offering is the #1 reason we win with customers • Supports learners with a unified platform, consistent pedagogy and more complete learning journeys • Creates opportunities for cross - and upsell • Drives higher retention 21 PERCENTAGE POINT HIGHER DOLLAR RETENTION RATE 1 AMONG CUSTOMERS PURCHASING 3 PRODUCTS VS. 1 LEADERSHIP & BUSINESS SKILLS TECHNOLOGY & DEVELOPMENT COMPLIANCE Note: 1 Covers Q4FY2017 through Q1FY2022.
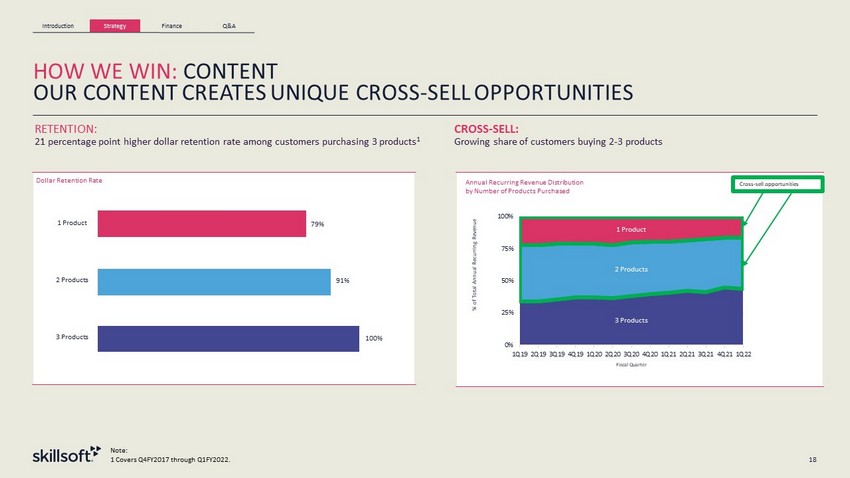
Introduction Strategy Finance Q&A 18 Note: 1 Covers Q4FY2017 through Q1FY2022. HOW WE WIN: CONTENT OUR CONTENT CREATES UNIQUE CROSS - SELL OPPORTUNITIES CROSS - SELL: Growing share of customers buying 2 - 3 products RETENTION: 21 percentage point higher dollar retention rate among customers purchasing 3 products 1 Dollar Retention Rate Annual Recurring Revenue Distribution by Number of Products Purchased 3 Products 2 Products 1 Product 0% 25% 50% 75% 100% 1Q19 2Q19 3Q19 4Q19 1Q20 2Q20 3Q20 4Q20 1Q21 2Q21 3Q21 4Q21 1Q22 % of Total Annual Recurring Revenue Fiscal Quarter 1 Product 2 Products 3 Products 91% 100% 79% Cross - sell opportunities 79%
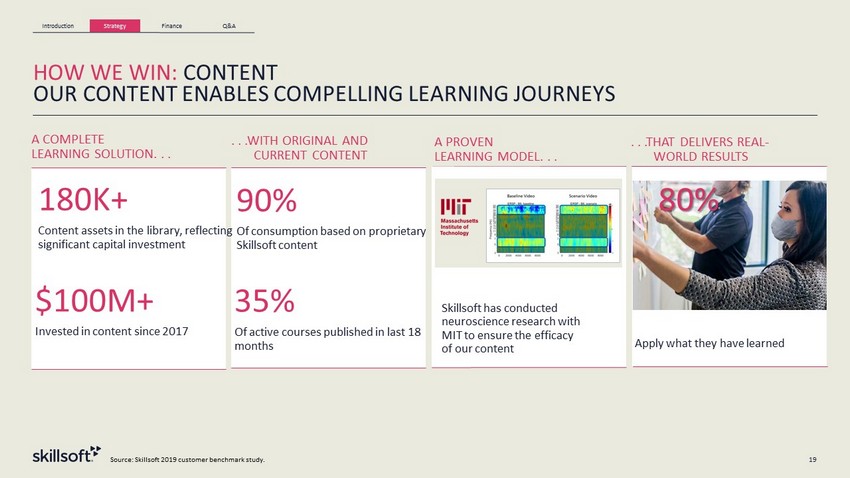
Introduction Strategy Finance Q&A 19 HOW WE WIN: CONTENT OUR CONTENT ENABLES COMPELLING LEARNING JOURNEYS . . .WITH ORIGINAL AND CURRENT CONTENT A PROVEN LEARNING MODEL. . . . . .THAT DELIVERS REAL - WORLD RESULTS 90 % Of consumption based on proprietary Skillsoft content Skillsoft has conducted neuroscience research with MIT to ensure the efficacy of our content Source: Skillsoft 2019 customer benchmark study. Apply what they have learned 35 % Of active courses published in last 18 months 80% A COMPLETE LEARNING SOLUTION. . . 180K+ Content assets in the library, reflecting significant capital investment $ 100M+ Invested in content since 2017
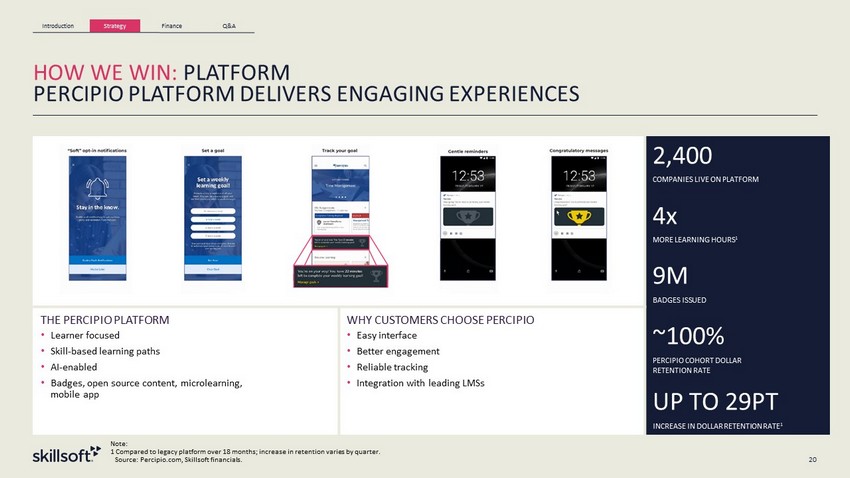
Introduction Strategy Finance Q&A HOW WE WIN: PLATFORM PERCIPIO PLATFORM DELIVERS ENGAGING EXPERIENCES 2,400 COMPANIES LIVE ON PLATFORM 4 x MORE LEARNING HOURS 1 9M BADGES ISSUED ~ 100 % PERCIPIO COHORT DOLLAR RETENTION RATE UP TO 29 PT INCREASE IN DOLLAR RETENTION RATE 1 THE PERCIPIO PLATFORM • Learner focused • Skill - based learning paths • AI - enabled • Badges, open source content, microlearning, mobile app WHY CUSTOMERS CHOOSE PERCIPIO • Easy interface • Better engagement • Reliable tracking • Integration with leading LMSs 20 Note: 1 Compared to legacy platform over 18 months; increase in retention varies by quarter . Source: Percipio.com, Skillsoft financials.
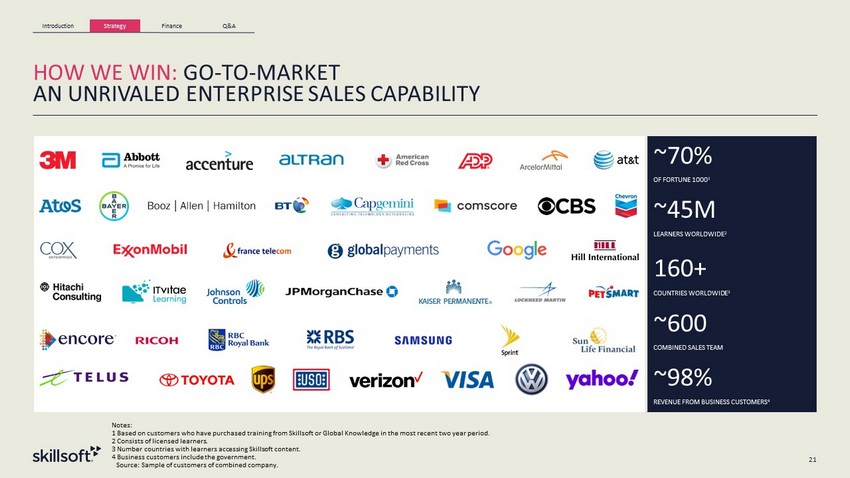
Introduction Strategy Finance Q&A ~ 70 % OF FORTUNE 1000 1 ~ 45 M LEARNERS WORLDWIDE 2 160 + COUNTRIES WORLDWIDE 3 ~ 600 COMBINED SALES TEAM ~ 98 % REVENUE FROM BUSINESS CUSTOMERS 4 HOW WE WIN: GO - TO - MARKET AN UNRIVALED ENTERPRISE SALES CAPABILITY 21 Notes: 1 Based on customers who have purchased training from Skillsoft or Global Knowledge in the most recent two year period. 2 Consists of licensed learners. 3 Number countries with learners accessing Skillsoft content. 4 Business customers include the government. Source: Sample of customers of combined company.
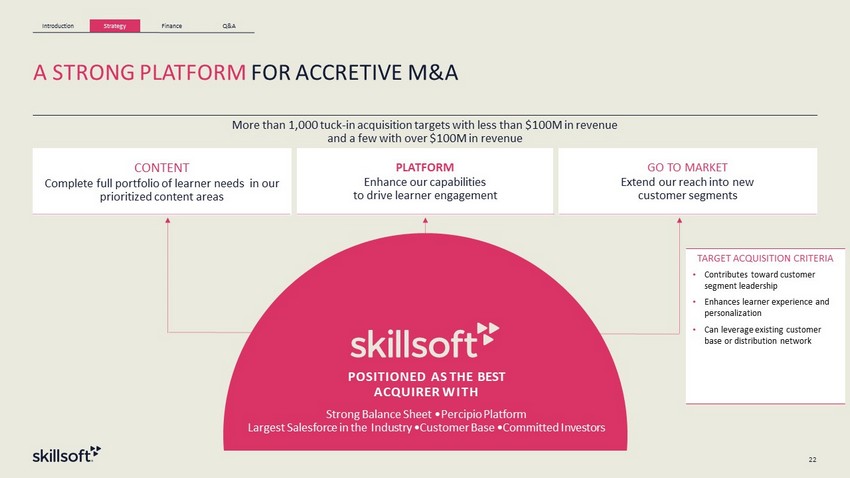
Introduction Strategy Finance Q&A A STRONG PLATFORM FOR ACCRETIVE M&A CONTENT Complete full portfolio of learner needs in our prioritized content areas PLATFORM Enhance our capabilities to drive learner engagement GO TO MARKET Extend our reach into new customer segments More than 1,000 tuck - in acquisition targets with less than $100 M in revenue and a few with over $100 M in revenue POSITIONED AS THE BEST ACQUIRER WITH Strong Balance Sheet • Percipio Platform Largest Salesforce in the Industry • Customer Base • Committed I nvestors TARGET ACQUISITION CRITERIA • Contributes toward customer segment leadership • Enhances learner experience and personalization • Can leverage existing customer base or distribution network 22
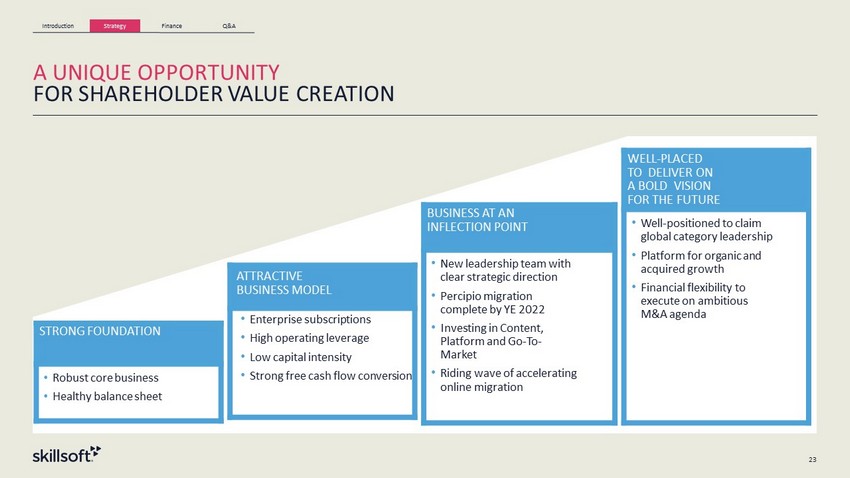
Introduction Strategy Finance Q&A 23 A UNIQUE OPPORTUNITY FOR SHAREHOLDER VALUE CREATION ATTRACTIVE BUSINESS MODEL • Enterprise subscriptions • High operating leverage • Low capital intensity • Strong free cash flow conversion BUSINESS AT AN INFLECTION POINT • New leadership team with clear strategic direction • Percipio migration complete by YE 2022 • I nvesting in Content, Platform and Go - To - Market • Riding wave of accelerating online migration WELL - PLACED TO DELIVER ON A BOLD VISION FOR THE FUTURE • Well - positioned to claim global category leadership • P latform for organic and acquired growth • Financia l flexibility to e xecute on ambitious M&A a genda STRONG FOUNDATION • Robust core business • Healthy balance sheet
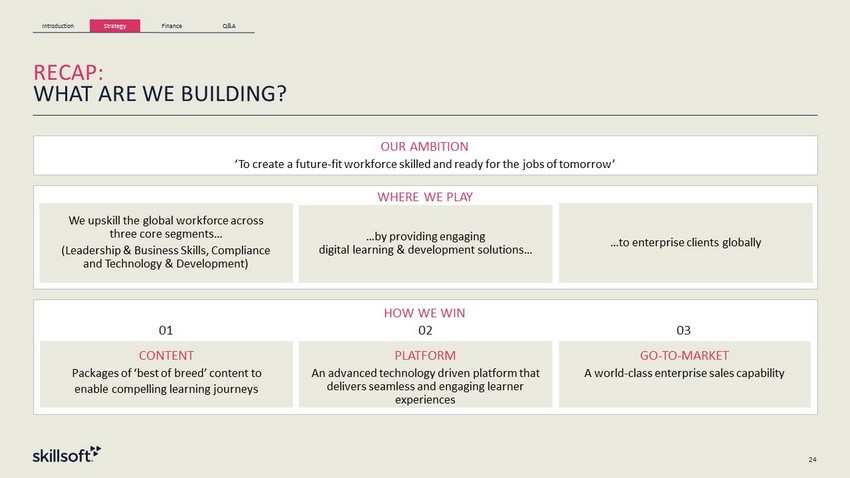
Introduction Strategy Finance Q&A RECAP: WHAT ARE WE BUILDING? WHERE WE PLAY We upskill the global workforce across three core segments… (Leadership & Business Skills, Compliance and Technology & Development) …by providing engaging digital learning & development solutions… …to enterprise clients globally OUR AMBITION ‘To create a future - fit workforce skilled and ready for the jobs of tomorrow’ HOW WE WIN CONTENT Packages of ‘best of breed’ content to enable compelling learning journeys PLATFORM An advanced technology driven platform that delivers seamless and engaging learner experiences GO - TO - MARKET A world - class enterprise sales capability 01 02 03 24

Introduction Strategy Finance Q&A FINANCE 25
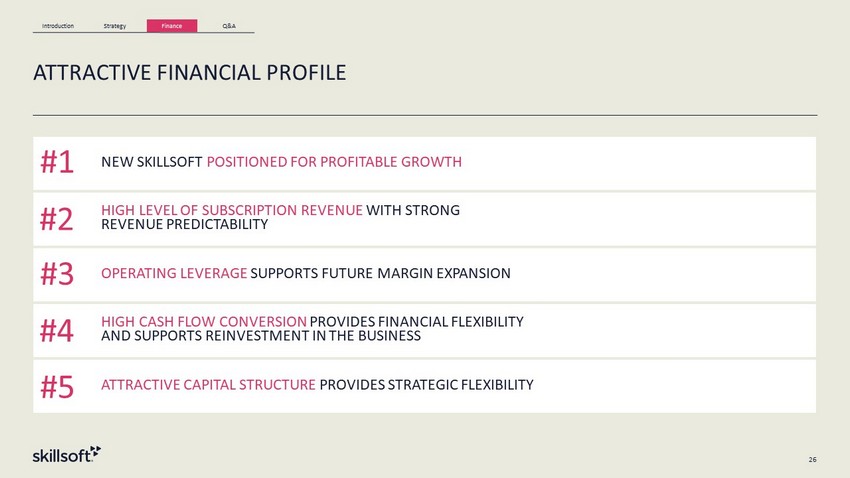
Introduction Strategy Finance Q&A NEW SKILLSOFT POSITIONED FOR PROFITABLE GROWTH HIGH LEVEL OF SUBSCRIPTION REVENUE WITH STRONG REVENUE PREDICTABILITY OPERATING LEVERAGE SUPPORTS FUTURE MARGIN EXPANSION HIGH CASH FLOW CONVERSION PROVIDES FINANCIAL FLEXIBILITY AND SUPPORTS REINVESTMENT IN THE BUSINESS ATTRACTIVE CAPITAL STRUCTURE PROVIDES STRATEGIC FLEXIBILITY 26 ATTRACTIVE FINANCIAL PROFILE # 1 # 2 # 3 # 4 # 5
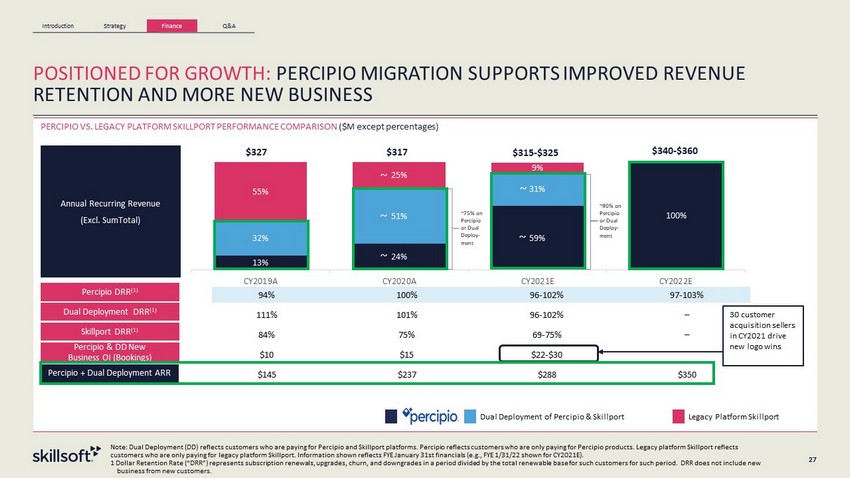
Introduction Strategy Finance Q&A 27 POSITIONED FOR GROWTH: PERCIPIO MIGRATION SUPPORTS IMPROVED REVENUE RETENTION AND MORE NEW BUSINESS Note: Dual Deployment (DD) reflects customers who are paying for Percipio and Skillport platforms. Percipio reflects customer s w ho are only paying for Percipio products. Legacy platform Skillport reflects customers who are only paying for legacy platform Skillport. Information shown reflects FYE January 31st financials (e.g., FY E 1 /31/22 shown for CY2021E). 1 Dollar Retention Rate (“DRR”) represents subscription renewals, upgrades, churn, and downgrades in a period divided by the tot al renewable base for such customers for such period. DRR does not include new business from new customers. PERCIPIO VS. LEGACY PLATFORM SKILLPORT PERFORMANCE COMPARISON ($M except percentages) Dual Deployment of Percipio & Skillport Legacy Platform Skillport 13% 24% 59% 100% 32% 51% 31% 55 % 25 % 9 % CY2019A CY2020A CY2021E CY2022E 94% 100% 96 - 102% 97 - 103% 111% 101% 96 - 102% – 84% 75% 69 - 75% – $10 $145 $15 $237 $22 - $30 $288 $350 27 Annual Recurring Revenue (Excl. SumTotal) 27 Percipio DRR (1) Dual Deployment DRR (1) Skillport DRR (1) Percipio & DD New Business OI (Bookings) $ 327 $ 317 $ 315 - $325 $ 340 - $360 ~ ~ ~ ~ ~ ~ ~75% on Percipio or Dual Deploy - ment ~90% on Percipio or Dual Deploy - ment 30 customer acquisition sellers in CY2021 drive new logo wins Percipio + Dual Deployment ARR
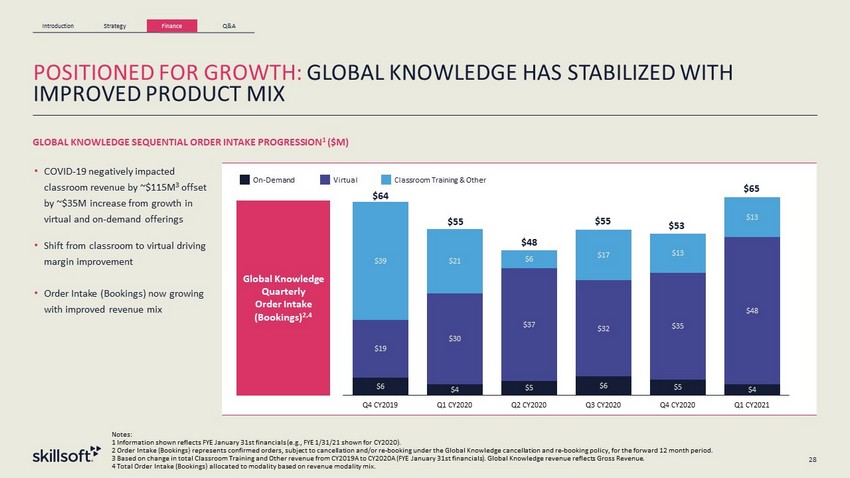
Introduction Strategy Finance Q&A 28 POSITIONED FOR GROWTH: GLOBAL KNOWLEDGE HAS STABILIZED WITH IMPROVED PRODUCT MIX • COVID - 19 negatively impacted classroom revenue by ~$115M 3 offset by ~$35M increase from growth in virtual and on - demand offerings • Shift from classroom to virtual driving margin improvement • Order I ntake (Bookings) now growing with improved revenue mix GLOBAL KNOWLEDGE SEQUENTIAL ORDER INTAKE PROGRESSION 1 ($M) Global Knowledge Quarterly Order Intake (Bookings) 2,4 On - Demand Classroom Training & Other Virtual $6 $4 $5 $6 $5 $4 $19 $30 $37 $32 $35 $48 $39 $21 $6 $17 $13 $13 Q4 CY2019 Q1 CY2020 Q2 CY2020 Q3 CY2020 Q4 CY2020 Q1 CY2021 $64 $55 $48 $53 $55 $65 Notes: 1 Information shown reflects FYE January 31st financials (e.g., FYE 1/31/21 shown for CY2020). 2 Order Intake (Bookings) represents confirmed orders, subject to cancellation and/or re - booking under the Global Knowledge canc ellation and re - booking policy, for the forward 12 month period. 3 Based on change in total Classroom Training and Other revenue from CY2019A to CY2020A (FYE January 31st financials). Global Kn owledge revenue reflects Gross Revenue. 4 Total Order Intake (Bookings) allocated to modality based on revenue modality mix.
Introduction Strategy Finance Q&A 29 NEW SKILLSOFT POSITIONED FOR GROWTH Note: Product level view of Order Intake / Revenue for Skillsoft Content and SumTotal. Reconciliation of non - GAAP financial meas ures provided in appendix. 1 CY2019A reflects 1/31/20A financials for Skillsoft and 9/27/19A for Global Knowledge. CY2020A reflects 1/31/21A financials for Skillsoft and 1/1/21A for Global Knowledge. 2 Reflects FYE January 31st financials (e.g., FYE 1/31/22E shown for CY2021E). 3 CY2020A Adjusted Gross Revenue of $691M represents Skillsoft results for FYE 1/31/21, $474M (page 150 of Amended S - 4 filed on Ma y 12, 2021) + Global Knowledge results for the twelve months ended 1/1/21 [Net Revenue of $190M (page 203 of Amended S - 4 filed on May 12, 2021) plus reseller fees of $27M (pages 208 and 213 of Amended S - 4 filed on May 12, 20 21)]. CY2020A Combined Net Revenue is $474M + $190M = $664M. CY2019A Combined Net Revenue and Illustrative Combined Net Revenue outlook for CY2021 and CY2022 in Appendix. 4 CY2020A Adjusted EBITDA of $163M represents Skillsoft results for FYE 1/31/21, $145M (page 151 of Amended S - 4 filed on May 12, 2021) + Global Knowledge results for the twelve months ended 1/1/21 of $18M (page 200 of Amended S - 4 filed on May 12, 2021). $15M of cost synergies expected in the first twelve months after closing. $25M run rate synergies expected by the end of the se cond twelve months post - close. Order Intake Adj. Gross Revenue 3 Adj. EBITDA 4 Adj. EBITDA Margin Actuals Outlook • Order intake o Percipio migration - > retention improvement o Sales realignment and over 30 new customer acquisition sellers: driving new business o GK growth: COVID rebound and migration to digital o Cross - sell driving new revenue and retention • High single digit order intake growth in 2022 approaching industry growth rate • 30 - 35% target long - term Adj. EBITDA margin driven by revenue growth and operating leverage Commentary CY 2019A 1 CY 2020A 1 CY 2021E 2 CY 2022E 2 $660 - $690 $710 - $760 $645 - $675 $675 - $725 $155 - $175 $180 - $220 24 - 26% 26 - 30% $669 $691 $163 23.6% $777 $808 $219 27.1% $M
Introduction Strategy Finance Q&A 30 HIGH SUBSCRIPTION REVENUE WITH STRONG PREDICTABILITY Notes: 1 CY2020A reflects financials for the fiscal year ended 1/31/21 for Skillsoft and the twelve months ended 1/1/21 for Global K now ledge. 2 CY2022E reflects FYE January 31st financials (e.g., FYE 1/31/23E shown for CY2022E). Subscription Revenue Non - subscription Revenue SKILLSOFT • Subscription - based business provides significant visibility and predictability o 90%+ subscription revenue base at Skillsoft o Recurring contracts with Fortune 1000 customers • Global Knowledge a mix of transaction - based - long - standing customer relationships with repeat buyers and growing subscription offerings GLOBAL KNOWLEDGE COMBINED ~5% ~95% CY2020A¹ ~63% ~37% CY2020A¹ ~68% ~32% CY2022E² ~25% ~75% CY2022E² ~90% ~10% CY2020A¹ ~92% ~8% CY2022E²
Introduction Strategy Finance Q&A 31 HIGH CASH FLOW CONVERSION PROVIDE FINANCIAL FLEXIBILITY AND SUPPORT REINVESTMENT ILLUSTRATIVE CY2022E FREE CASH FLOW BRIDGE ($M; Cash Flow items shown as % of Adj. EBITDA) • High cash conversion of 70%+ supports growth • Low capital expenditure requirements (~3% of revenue) • Refinancing lowers interest expense • Corporate structure allows for favorable low teens cash tax rate • Order Intake growth will drive positive net working capital cash contribution • Due to delayed close, restructuring costs likely to flow into CY2022E $180 - $220 $135 - $165 ~9 - 12% ~9 - 10% ~10 - 14% ~5 - 10% 0 50 100 150 200 250 CY2022E Adj. EBITDA Interest Expense, net Cash Taxes Capital Expenditures Change in Net Working Capital CY2022E Levered Free Cash Flow 1 Note: Reflects FYE January 31st financials (e.g., FYE 1/31/23E shown for CY2022E). Does not include integration, restructuri ng and acquisition related expenditures. CY2021E free cash flow conversion lower than for CY2022E due to restructuring costs and higher interest expense from higher pre - closing debt balances and interest rates. 1 Includes Services and Other Investments related to Percipio migration equal to ~1% of Adj. EBITDA; not expected beyond CY2022E .
Introduction Strategy Finance Q&A ATTRACTIVE CAPITAL STRUCTURE AND PARTNER SUPPORT PROVIDE STRATEGIC FLEXIBILITY Notes: 1 Based on pro forma balance sheets as of March 31, 2021 and debt and cash immediately after consummation of the combination of Sk illsoft and Churchill Capital Corp II and the acquisition of Global Knowledge. 2 Based on $165M, midpoint of CY2021E Adjusted EBITDA outlook range. CHURCHI L L C API T AL CAPITAL STRUCTURE DOES NOT REFLECT REFINANCING CURRENTLY UNDERWAY ($M) TOTAL DEBT 1 $ 584 CASH 1 $ 260 NET DEBT $ 324 DEBT / TRAILING ADJ. EBITDA 2 (GROSS / NET) 3.5X/2.0X COMMITTED INVESTOR BASE 32
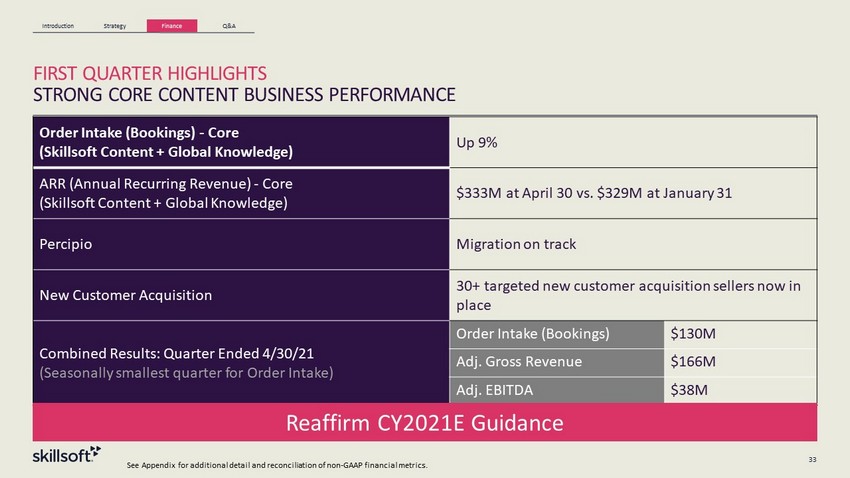
Introduction Strategy Finance Q&A 33 FIRST QUARTER HIGHLIGHTS STRONG CORE CONTENT BUSINESS PERFORMANCE See Appendix for additional detail and reconciliation of non - GAAP financial metrics. Order Intake (Bookings) - Core (Skillsoft Content + Global Knowledge) Up 9% ARR (Annual Recurring Revenue) - Core (Skillsoft Content + Global Knowledge) $333M at April 30 vs. $329M at January 31 Percipio Migration on track New Customer Acquisition 30+ targeted new customer acquisition sellers now in place Combined Results: Quarter Ended 4/30/21 (Seasonally smallest quarter for Order Intake) Order Intake (Bookings) $130M Adj. Gross Revenue $166M Adj. EBITDA $38M Reaffirm CY2021E Guidance
Introduction Strategy Finance Q&A 34 THE NEW SKILLSOFT 01 An attractive market opportunity without a clear leader 02 Building a global leader from a strong foundation 03 A strong platform for further M&A 04 An attractive business model and investment opportunity

Introduction Strategy Finance Q&A Q&A 35

APPENDIX 36
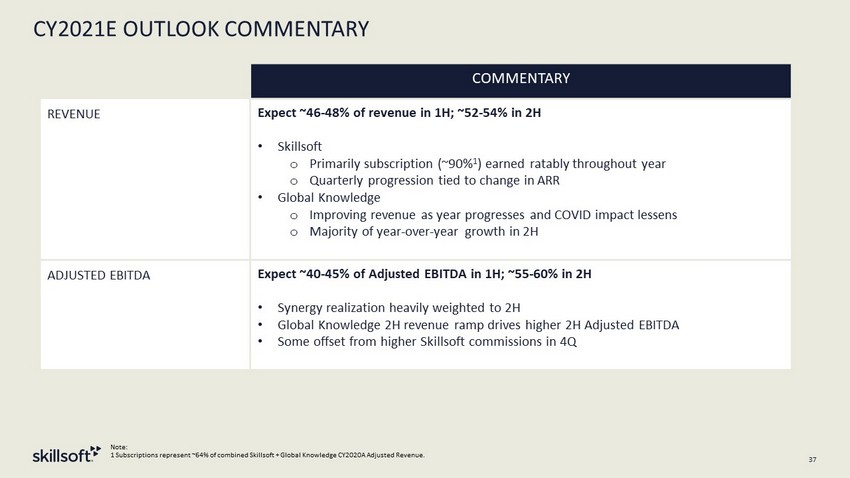
CY2021E OUTLOOK COMMENTARY 37 COMMENTARY REVENUE Expect ~46 - 48% of revenue in 1H; ~52 - 54% in 2H • Skillsoft o Primarily subscription (~90% 1 ) earned ratably throughout year o Quarterly progression tied to change in ARR • Global Knowledge o Improving revenue as year progresses and COVID impact lessens o Majority of year - over - year growth in 2H ADJUSTED EBITDA Expect ~40 - 45% of Adjusted EBITDA in 1H; ~55 - 60% in 2H • Synergy realization heavily weighted to 2H • Global Knowledge 2H revenue ramp drives higher 2H Adjusted EBITDA • Some offset from higher Skillsoft commissions in 4Q Note: 1 Subscriptions represent ~64% of combined Skillsoft + Global Knowledge CY2020A Adjusted Revenue.
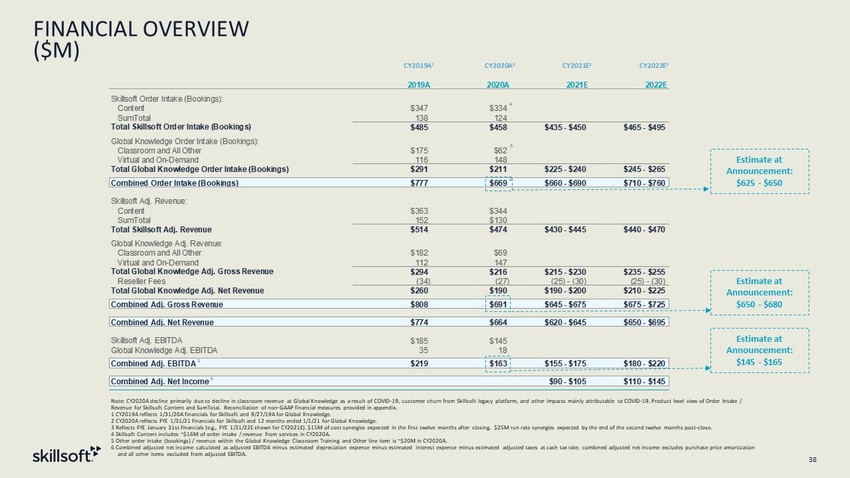
2019A 2020A 2021E 2022E Skillsoft Order Intake (Bookings): Content $347 $334 SumTotal 138 124 Total Skillsoft Order Intake (Bookings) $485 $458 $435 - $450 $465 - $495 Global Knowledge Order Intake (Bookings): Classroom and All Other $175 $62 Virtual and On-Demand 116 148 Total Global Knowledge Order Intake (Bookings) $291 $211 $225 - $240 $245 - $265 Combined Order Intake (Bookings) $777 $669 $660 - $690 $710 - $760 Skillsoft Adj. Revenue: Content $363 $344 SumTotal 152 $130 Total Skillsoft Adj. Revenue $514 $474 $430 - $445 $440 - $470 Global Knowledge Adj. Revenue: Classroom and All Other $182 $69 Virtual and On-Demand 112 147 Total Global Knowledge Adj. Gross Revenue $294 $216 $215 - $230 $235 - $255 Reseller Fees (34) (27) (25) - (30) (25) - (30) Total Global Knowledge Adj. Net Revenue $260 $190 $190 - $200 $210 - $225 Combined Adj. Gross Revenue $808 $691 $645 - $675 $675 - $725 Combined Adj. Net Revenue $774 $664 $620 - $645 $650 - $695 Skillsoft Adj. EBITDA $185 $145 Global Knowledge Adj. EBITDA 35 18 Combined Adj. EBITDA $219 $163 $155 - $175 $180 - $220 Combined Adj. Net Income $90 - $105 $110 - $145 FINANCIAL OVERVIEW ($M) 38 Note: CY2020A decline primarily due to decline in classroom revenue at Global Knowledge as a result of COVID - 19, customer churn from Skillsoft legacy platform, and other impacts mainly attributable to COVID - 19. Product level view of Order Intake / Revenue for Skillsoft Content and SumTotal. Reconciliation of non - GAAP financial measures provided in appendix. 1 CY2019A reflects 1/31/20A financials for Skillsoft and 9/27/19A for Global Knowledge. 2 CY2020A reflects FYE 1/31/21 financials for Skillsoft and 12 months ended 1/1/21 for Global Knowledge. 3 Reflects FYE January 31st financials (e.g., FYE 1/31/22E shown for CY2021E). $15M of cost synergies expected in the first twelve months after closing. $25M run rate synergies expected by the end of the se cond twelve months post - close. 4 Skillsoft Content includes ~$16M of order intake / revenue from services in CY2020A. 5 Other order intake (bookings) / revenue within the Global Knowledge Classroom Training and Other line item is ~$20M in CY20 20A . 6 Combined adjusted net income calculated as adjusted EBITDA minus estimated depreciation expense minus estimated interest ex pen se minus estimated adjusted taxes at cash tax rate; combined adjusted net income excludes purchase price amortization and all other items excluded from adjusted EBITDA. 4 4 5 1 3 2 3 4 4 Estimate at Announcement: $625 - $650 Estimate at Announcement: $650 - $680 Estimate at Announcement: $145 - $165 CY2020A 2 CY2021E 3 CY2022E 3 CY2019A 1 6
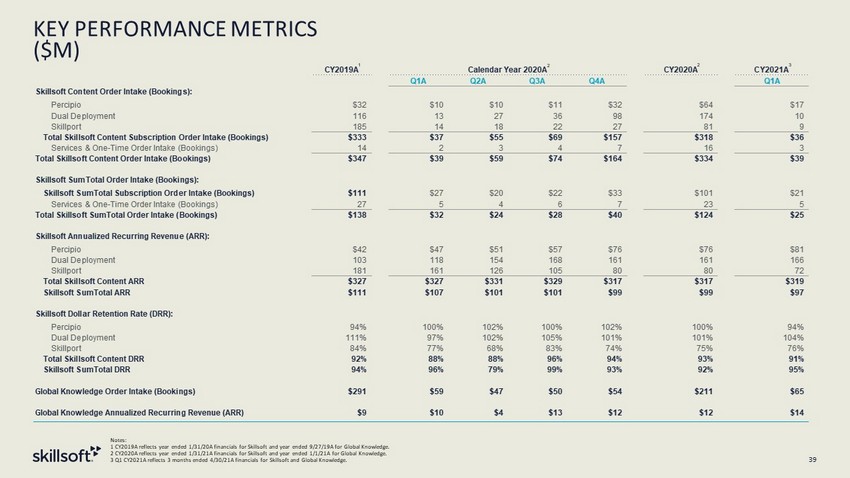
KEY PERFORMANCE METRICS ($M) 39 2 CY2019A Calendar Year 2020A CY2020A CY2021A Q1A Q2A Q3A Q4A Q1A Skillsoft Content Order Intake (Bookings): Percipio $32 $10 $10 $11 $32 $64 $17 Dual Deployment 116 13 27 36 98 174 10 Skillport 185 14 18 22 27 81 9 Total Skillsoft Content Subscription Order Intake (Bookings) $333 $37 $55 $69 $157 $318 $36 Services & One-Time Order Intake (Bookings) 14 2 3 4 7 16 3 Total Skillsoft Content Order Intake (Bookings) $347 $39 $59 $74 $164 $334 $39 Skillsoft SumTotal Order Intake (Bookings): Skillsoft SumTotal Subscription Order Intake (Bookings) $111 $27 $20 $22 $33 $101 $21 Services & One-Time Order Intake (Bookings) 27 5 4 6 7 23 5 Total Skillsoft SumTotal Order Intake (Bookings) $138 $32 $24 $28 $40 $124 $25 Skillsoft Annualized Recurring Revenue (ARR): Percipio $42 $47 $51 $57 $76 $76 $81 Dual Deployment 103 118 154 168 161 161 166 Skillport 181 161 126 105 80 80 72 Total Skillsoft Content ARR $327 $327 $331 $329 $317 $317 $319 Skillsoft SumTotal ARR $111 $107 $101 $101 $99 $99 $97 Skillsoft Dollar Retention Rate (DRR): Percipio 94% 100% 102% 100% 102% 100% 94% Dual Deployment 111% 97% 102% 105% 101% 101% 104% Skillport 84% 77% 68% 83% 74% 75% 76% Total Skillsoft Content DRR 92% 88% 88% 96% 94% 93% 91% Skillsoft SumTotal DRR 94% 96% 79% 99% 93% 92% 95% Global Knowledge Order Intake (Bookings) $291 $59 $47 $50 $54 $211 $65 Global Knowledge Annualized Recurring Revenue (ARR) $9 $10 $4 $13 $12 $12 $14 1 2 3 Notes: 1 CY2019A reflects year ended 1/31/20A financials for Skillsoft and year ended 9/27/19A for Global Knowledge. 2 CY2020A reflects year ended 1/31/21A financials for Skillsoft and year ended 1/1/21A for Global Knowledge. 3 Q1 CY2021A reflects 3 months ended 4/30/21A financials for Skillsoft and Global Knowledge.
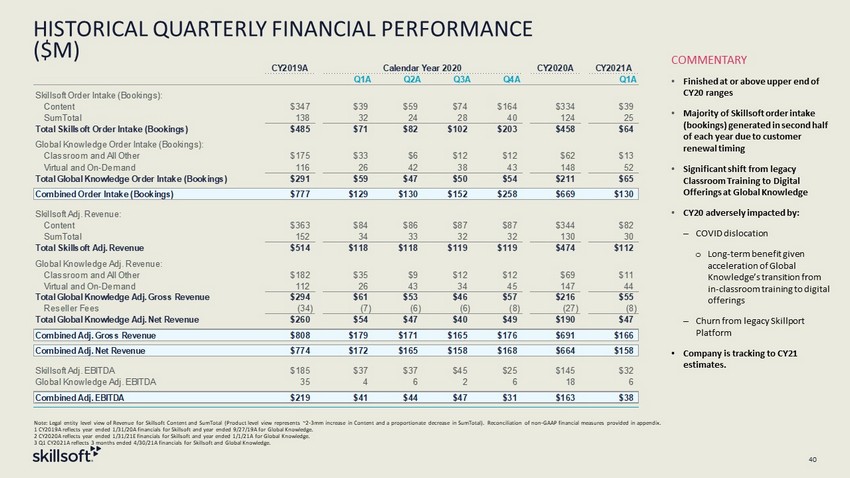
HISTORICAL QUARTERLY FINANCIAL PERFORMANCE ($M) 40 COMMENTARY • Finished at or above upper end of CY20 ranges • Majority of Skillsoft order intake (bookings) generated in second half of each year due to customer renewal timing • Significant shift from legacy Classroom Training to Digital Offerings at Global Knowledge • CY20 adversely impacted by: ‒ COVID dislocation o Long - term benefit given acceleration of Global Knowledge’s transition from in - classroom training to digital offerings ‒ Churn from legacy Skillport Platform • Company is tracking to CY21 estimates. 1 2 2 CY2019A Calendar Year 2020 CY2020A CY2021A Q1A Q2A Q3A Q4A Q1A Skillsoft Order Intake (Bookings): Content $347 $39 $59 $74 $164 $334 $39 SumTotal 138 32 24 28 40 124 25 Total Skillsoft Order Intake (Bookings) $485 $71 $82 $102 $203 $458 $64 Global Knowledge Order Intake (Bookings): Classroom and All Other $175 $33 $6 $12 $12 $62 $13 Virtual and On-Demand 116 26 42 38 43 148 52 Total Global Knowledge Order Intake (Bookings) $291 $59 $47 $50 $54 $211 $65 Combined Order Intake (Bookings) $777 $129 $130 $152 $258 $669 $130 Skillsoft Adj. Revenue: Content $363 $84 $86 $87 $87 $344 $82 SumTotal 152 34 33 32 32 130 30 Total Skillsoft Adj. Revenue $514 $118 $118 $119 $119 $474 $112 Global Knowledge Adj. Revenue: Classroom and All Other $182 $35 $9 $12 $12 $69 $11 Virtual and On-Demand 112 26 43 34 45 147 44 Total Global Knowledge Adj. Gross Revenue $294 $61 $53 $46 $57 $216 $55 Reseller Fees (34) (7) (6) (6) (8) (27) (8) Total Global Knowledge Adj. Net Revenue $260 $54 $47 $40 $49 $190 $47 Combined Adj. Gross Revenue $808 $179 $171 $165 $176 $691 $166 Combined Adj. Net Revenue $774 $172 $165 $158 $168 $664 $158 Skillsoft Adj. EBITDA $185 $37 $37 $45 $25 $145 $32 Global Knowledge Adj. EBITDA 35 4 6 2 6 18 6 Combined Adj. EBITDA $219 $41 $44 $47 $31 $163 $38 Note: Legal entity level view of Revenue for Skillsoft Content and SumTotal (Product level view represents ~2 - 3mm increase in Co ntent and a proportionate decrease in SumTotal). Reconciliation of non - GAAP financial measures provided in appendix. 1 CY2019A reflects year ended 1/31/20A financials for Skillsoft and year ended 9/27/19A for Global Knowledge. 2 CY2020A reflects year ended 1/31/21E financials for Skillsoft and year ended 1/1/21A for Global Knowledge. 3 Q1 CY2021A reflects 3 months ended 4/30/21A financials for Skillsoft and Global Knowledge.
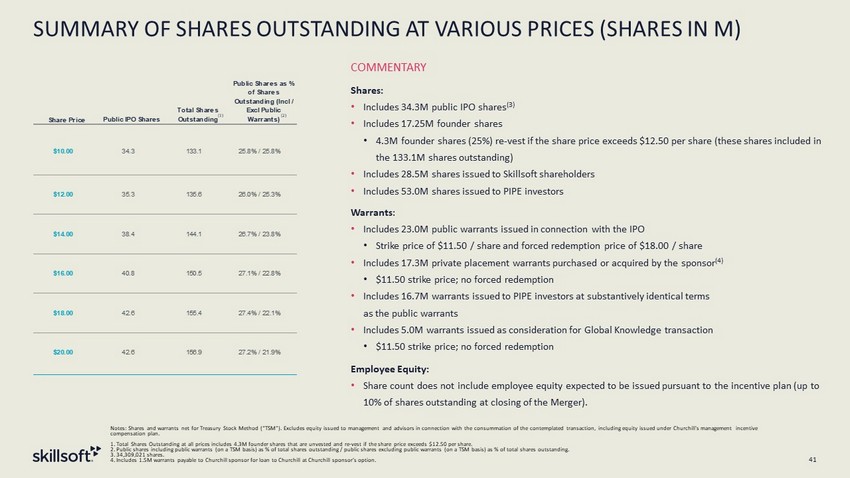
SUMMARY OF SHARES OUTSTANDING AT VARIOUS PRICES (SHARES IN M) 41 Notes: Shares and warrants net for Treasury Stock Method (“TSM”). Excludes equity issued to management and advisors in connec tio n with the consummation of the contemplated transaction, including equity issued under Churchill's management incentive compensation plan. 1. Total Shares Outstanding at all prices includes 4.3M founder shares that are unvested and re - vest if the share price exceeds $12.50 per share. 2. Public shares including public warrants (on a TSM basis) as % of total shares outstanding / public shares excluding public wa rrants (on a TSM basis) as % of total shares outstanding. 3. 34,309,021 shares. 4. Includes 1.5M warrants payable to Churchill sponsor for loan to Churchill at Churchill sponsor’s option. Shares: • Includes 34.3M public IPO shares (3) • Includes 17.25M founder shares • 4.3M founder shares (25%) re - vest if the share price exceeds $12.50 per share (these shares included in the 133.1M shares outstanding) • Includes 28.5M shares issued to Skillsoft shareholders • Includes 53.0M shares issued to PIPE investors Warrants : • Includes 23.0M public warrants issued in connection with the IPO • Strike price of $11.50 / share and forced redemption price of $18.00 / share • Includes 17.3M private placement warrants purchased or acquired by the sponsor (4) • $11.50 strike price; no forced redemption • Includes 16.7M warrants issued to PIPE investors at substantively identical terms as the public warrants • Includes 5.0M warrants issued as consideration for Global Knowledge transaction • $11.50 strike price; no forced redemption Employee Equity: • Share count does not include employee equity expected to be issued pursuant to the incentive plan (up to 10% of shares outstanding at closing of the Merger). (2) COMMENTARY Share Price Public IPO Shares Total Shares Outstanding Public Shares as % of Shares Outstanding (Incl / Excl Public Warrants) $10.00 34.3 133.1 25.8% / 25.8% $12.00 35.3 135.6 26.0% / 25.3% $14.00 38.4 144.1 26.7% / 23.8% $16.00 40.8 150.5 27.1% / 22.8% $18.00 42.6 155.4 27.4% / 22.1% $20.00 42.6 156.9 27.2% / 21.9% (1)
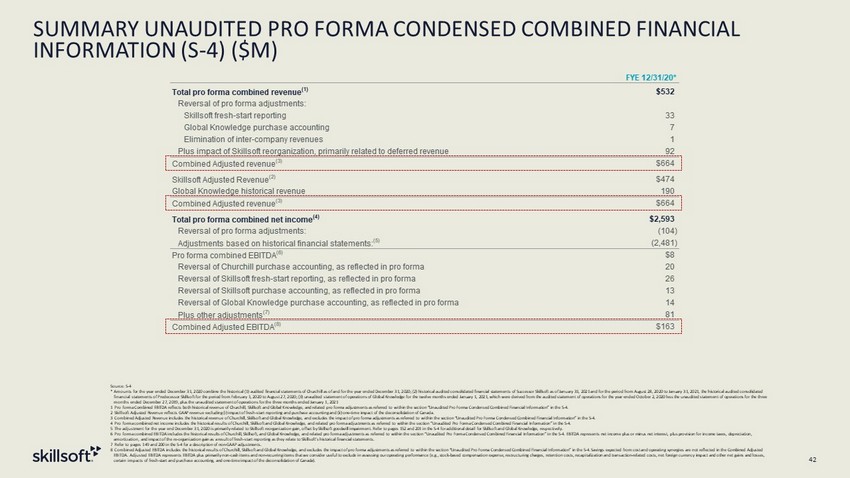
SUMMARY UNAUDITED PRO FORMA CONDENSED COMBINED FINANCIAL INFORMATION (S - 4) ($M) 42 Source: S - 4 * Amounts for the year ended December 31, 2020 combine the historical (1) audited financial statements of Churchill as of and f or the year ended December 31, 2020; (2) historical audited consolidated financial statements of Successor Skillsoft as of Janua ry 31, 2021 and for the period from August 28, 2020 to January 31, 2021, the historical audited consolidated financial statements of Predecessor Skillsoft for the period from February 1, 2020 to August 27, 2020; (3) unaudited statemen t o f operations of Global Knowledge for the twelve months ended January 1, 2021, which were derived from the audited statement o f o perations for the year ended October 2, 2020 less the unaudited statement of operations for the three months ended December 27, 2019, plus the unaudited statement of operations for the three months ended January 1, 2021 1 Pro forma Combined EBITDA reflects both historical revenue of Churchill, Skillsoft and Global Knowledge, and related pro form a a djustments as referred to within the section “Unaudited Pro Forma Condensed Combined Financial Information” in the S - 4. 2 Skillsoft Adjusted Revenue reflects GAAP revenue excluding (i) impact of fresh - start reporting and purchase accounting and (ii) one - time impact of the deconsolidation of Canada. 3 Combined Adjusted Revenue includes the historical revenue of Churchill, Skillsoft and Global Knowledge, and excludes the im pac t of pro forma adjustments as referred to within the section “Unaudited Pro Forma Condensed Combined Financial Information” i n t he S - 4. 4 Pro forma combined net income includes the historical results of Churchill, Skillsoft and Global Knowledge, and related pro fo rma adjustments as referred to within the section “Unaudited Pro Forma Condensed Combined Financial Information” in the S - 4. 5 The adjustment for the year end December 31, 2020 is primarily related to Skillsoft reorganization gain, offset by Skillsoft goo dwill impairment. Refer to pages 152 and 201 in the S - 4 for additional detail for Skillsoft and Global Knowledge, respectively. 6 Pro forma combined EBITDA includes the historical results of Churchill, Skillsoft, and Global Knowledge, and related pro fo rma adjustments as referred to within the section “Unaudited Pro Forma Condensed Combined Financial Information” in the S - 4. EBITDA represents net income plus or minus net interest, plus provision for income taxes, depreciation, amortization, and impact of the re - organization gain as a result of fresh - start reporting as they relate to Skillsoft’s historic al financial statements. 7 Refer to pages 149 and 200 in the S - 4 for a description of non - GAAP adjustments. 8 Combined Adjusted EBITDA includes the historical results of Churchill, Skillsoft and Global Knowledge, and excludes the imp act of pro forma adjustments as referred to within the section “Unaudited Pro Forma Condensed Combined Financial Information” in th e S - 4. Savings expected from cost and operating synergies are not reflected in the Combined Adjusted EBITDA. Adjusted EBITDA represents EBITDA plus primarily non - cash items and non - recurring items that we consider useful to exclu de in assessing our operating performance (e.g., stock - based compensation expense, restructuring charges, retention costs, recap italization and transaction - related costs, net foreign currency impact and other net gains and losses, certain impacts of fresh - start and purchase accounting, and one - time impact of the deconsolidation of Canada). FYE 12/31/20* Total pro forma combined revenue (1) $532 Reversal of pro forma adjustments: Skillsoft fresh-start reporting 33 Global Knowledge purchase accounting 7 Elimination of inter-company revenues 1 Plus impact of Skillsoft reorganization, primarily related to deferred revenue 92 Combined Adjusted revenue (3) $664 Skillsoft Adjusted Revenue (2) $474 Global Knowledge historical revenue 190 Combined Adjusted revenue (3) $664 Total pro forma combined net income (4) $2,593 Reversal of pro forma adjustments: (104) Adjustments based on historical financial statements: (5) (2,481) Pro forma combined EBITDA (6) $8 Reversal of Churchill purchase accounting, as reflected in pro forma 20 Reversal of Skillsoft fresh-start reporting, as reflected in pro forma 26 Reversal of Skillsoft purchase accounting, as reflected in pro forma 13 Reversal of Global Knowledge purchase accounting, as reflected in pro forma 14 Plus other adjustments (7) 81 Combined Adjusted EBITDA (8) $163

RECONCILIATION OF NON - GAAP FINANCIAL MEASURES (S - 4) ($M) 43 Source: S - 4 1 Calculation pursuant to credit agreement operative in those periods. CY2020A Skillsoft (1/31/21) Global Knowledge (1/1/21) Combined Net Revenue $383 $190 $572 Impact of fresh-start and purchase accounting 89 -- 89 One-time impact of the deconsolidation of Canada 3 -- 3 Adjusted Net Revenue $474 $190 $664 Reseller Fees -- 27 27 Adjusted Gross Revenue $474 $216 $691 Net income (loss) - GAAP $2,670 ($110) $2,561 Interest expense, net 188 32 220 Provision for income taxes 47 1 48 Depreciation and amortization 84 14 97 Impairment of goodwill and intangible assets 332 67 400 Impact of fresh-start and purchase accounting (3,243) -- (3,243) EBITDA $78 $4 $82 Non-recurring retention and consulting costs 13 2 15 Recapitalization and transaction-related costs 48 4 52 Restructuring and contract terminations 6 5 10 Integration and migration related 2 0 3 Foreign currency and other non-cash expense (4) 1 (4) Other add backs 2 2 4 Adjusted EBITDA $145 $18 $163 (1) Fresh - start accounting reduced deferred revenue amount on balance sheet
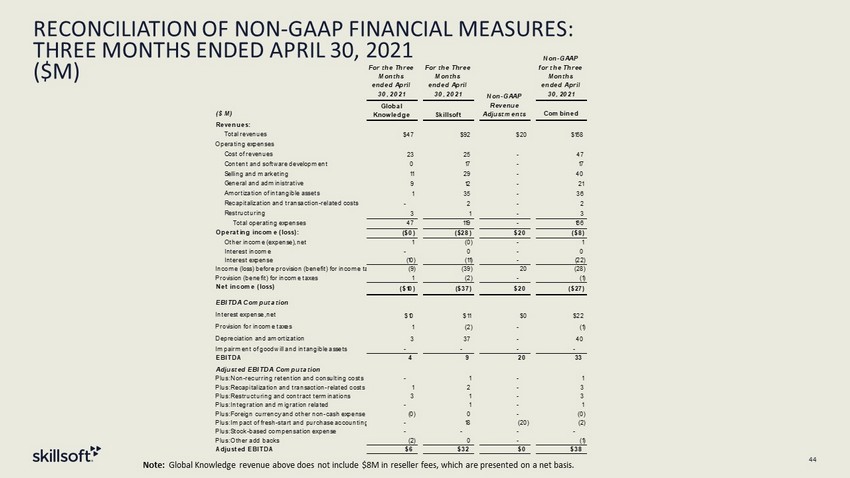
RECONCILIATION OF NON - GAAP FINANCIAL MEASURES: THREE MONTHS ENDED APRIL 30, 2021 ($M) 44 For the Three Months ended April 30, 2021 For the Three Months ended April 30, 2021 Non-GAAPfor the Three Months ended April 30, 2021 ($ M) Combined Revenues: Total revenues $47 $92 $20 $158 Operating expenses Cost of revenues 23 25 - 47 Content and software development 0 17 - 17 Selling and marketing 11 29 - 40 General and administrative 9 12 - 21 Amortization of intangible assets 1 35 - 36 Recapitalization and transaction-related costs - 2 - 2 Restructuring 3 1 - 3 Total operating expenses 47 119 - 166 Operating income (loss): ($0) ($28) $20 ($8) Other income (expense), net 1 (0) - 1 Interest income - 0 - 0 Interest expense (10) (11) - (22) Income (loss) before provision (benefit) for income taxes (9) (39) 20 (28) Provision (benefit) for income taxes 1 (2) - (1) Net income (loss) ($10) ($37) $20 ($27) EBITDA Computation Interest expense, net $10 $11 $0 $22 Provision for income taxes 1 (2) - (1) Depreciation and amortization 3 37 - 40 Impairment of goodwill and intangible assets - - - - EBITDA 4 9 20 33 Adjusted EBITDA Computation Plus: Non-recurring retention and consulting costs - 1 - 1 Plus: Recapitalization and transaction-related costs 1 2 - 3 Plus: Restructuring and contract terminations 3 1 - 3 Plus: Integration and migration related - 1 - 1 Plus: Foreign currency and other non-cash expense (0) 0 - (0) Plus: Impact of fresh-start and purchase accounting - 18 (20) (2) Plus: Stock-based compensation expense - - - - Plus: Other add backs (2) 0 - (1) Adjusted EBITDA $6 $32 $0 $38 Non-GAAP Revenue Adjustments Global Knowledge Skillsoft Note: Global Knowledge revenue above does not include $8M in reseller fees, which are presented on a net basis.
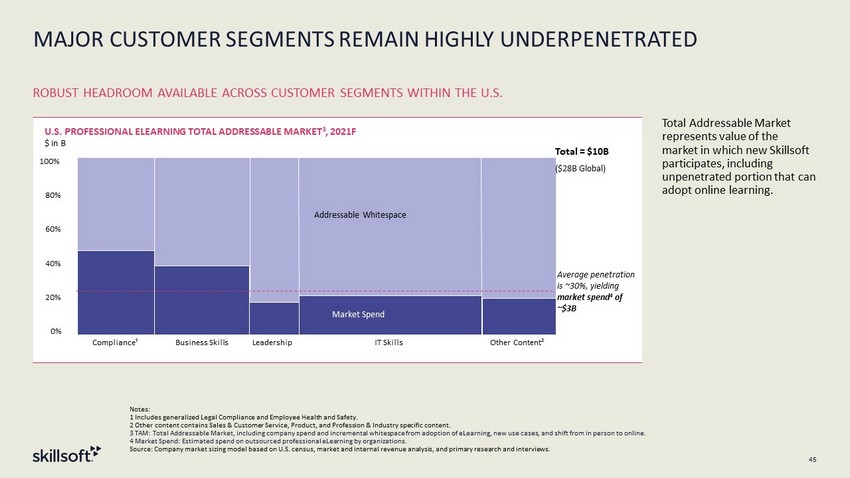
45 ROBUST HEADROOM AVAILABLE ACROSS CUSTOMER SEGMENTS WITHIN THE U.S. Total Addressable Market represents value of the market in which new Skillsoft participates, including unpenetrated portion that can adopt online learning. U.S. PROFESSIONAL ELEARNING TOTAL ADDRESSABLE MARKET 3 , 2021F $ in B 80% 40% 20% 0% 60% 100% IT Skills Business Skills Compliance¹ Leadership Addressable Whitespace Other Content² Average penetration is ~30%, yielding market spend 4 of ~$3B Total = $10B ($28B Global) Served Market Current outsourced OTS content spend Market Spend MAJOR CUSTOMER SEGMENTS REMAIN HIGHLY UNDERPENETRATED Notes: 1 Includes generalized Legal Compliance and Employee Health and Safety. 2 Other content contains Sales & Customer Service, Product, and Profession & Industry specific content. 3 TAM: Total Addressable Market, including company spend and incremental whitespace from adoption of eLearning, new use cases , a nd shift from in person to online. 4 Market Spend: Estimated spend on outsourced professional eLearning by organizations. Source: Company market sizing model based on U.S. census, market and internal revenue analysis, and primary research and inte rvi ews.
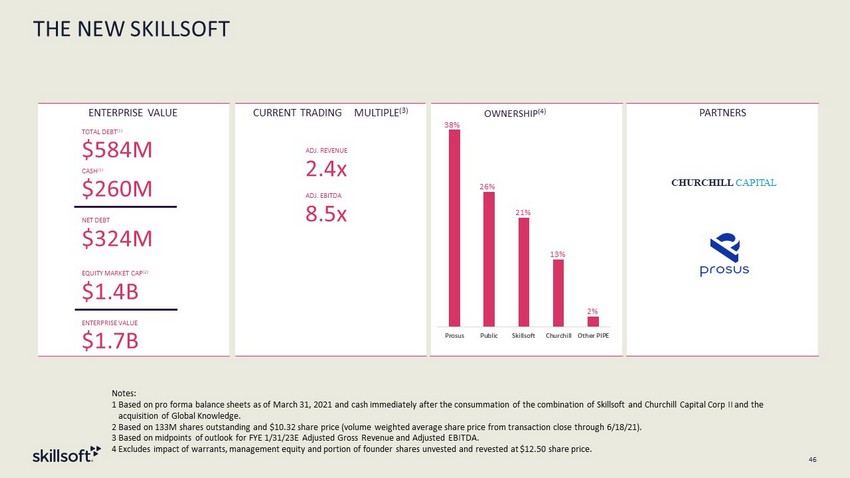
THE NEW SKILLSOFT 46 Prosus Public Skillsoft Churchill Other PIPE ENTERPRISE VALUE CURRENT TRADING MULTIPLE (3) PARTNERS TOTAL DEBT (1) $ 584M CASH (1) $ 260M NET DEBT $ 324M EQUITY MARKET CAP (2) $ 1.4B ENTERPRISE VALUE $ 1.7B ADJ. REVENUE 2.4 x ADJ. EBITDA 8.5 x CHURCHI L L C API T AL OWNERSHIP (4) 38% 26% 21% 13% Notes: 1 Based on pro forma balance sheets as of March 31, 2021 and cash immediately after the consummation of the combination of Sk ill soft and Churchill Capital Corp II and the acquisition of Global Knowledge. 2 Based on 133M shares outstanding and $10.32 share price (volume weighted average share price from transaction close through 6/ 18/21). 3 Based on midpoints of outlook for FYE 1/31/23E Adjusted Gross Revenue and Adjusted EBITDA. 4 Excludes impact of warrants, management equity and portion of founder shares unvested and revested at $12.50 share price. 2 %
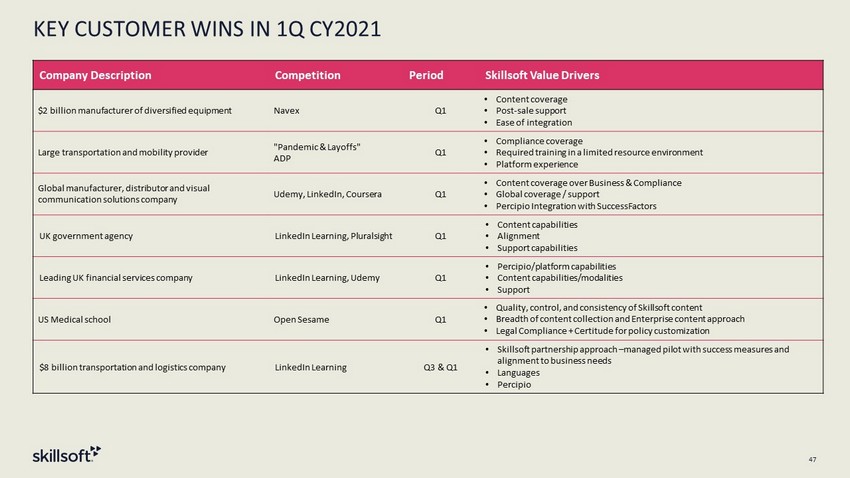
KEY CUSTOMER WINS IN 1Q CY2021 47 Company Description Competition Period Skillsoft Value Drivers $2 billion manufacturer of diversified equipment Navex Q1 • Content coverage • Post - sale support • Ease of integration Large transportation and mobility provider "Pandemic & Layoffs" ADP Q1 • Compliance coverage • Required training in a limited resource environment • Platform experience Global manufacturer, distributor and visual communication solutions company Udemy, LinkedIn, Coursera Q1 • Content coverage over Business & Compliance • Global coverage / support • Percipio Integration with SuccessFactors UK government agency LinkedIn Learning, Pluralsight Q1 • Content capabilities • Alignment • Support capabilities Leading UK financial services company LinkedIn Learning, Udemy Q1 • Percipio/platform capabilities • Content capabilities/modalities • Support US Medical school Open Sesame Q1 • Quality, control, and consistency of Skillsoft content • Breadth of content collection and Enterprise content approach • Legal Compliance + Certitude for policy customization $8 billion transportation and logistics company LinkedIn Learning Q3 & Q1 • Skillsoft partnership approach – managed pilot with success measures and alignment to business needs • Languages • Percipio
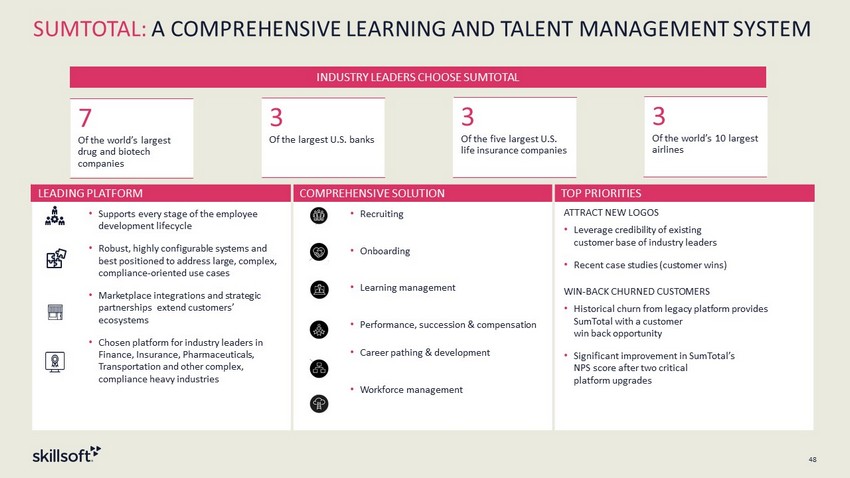
SUMTOTAL: A COMPREHENSIVE LEARNING AND TALENT MANAGEMENT SYSTEM 48 LEADING PLATFORM COMPREHENSIVE SOLUTION TOP PRIORITIES • Supports every stage of the employee development lifecycle • Robust, highly configurable systems and best positioned to address large, complex, compliance - oriented use cases • Marketplace integrations and strategic partnerships extend customers’ ecosystems • Chosen platform for industry leaders in Finance, Insurance, Pharmaceuticals, Transportation and other complex, compliance heavy industries • Recruiting • Onboarding • Learning management • Performance, succession & compensation • Career pathing & development • Workforce management ATTRACT NEW LOGOS • Leverage credibility of existing customer base of industry leaders • Recent case studies (customer wins) WIN - BACK CHURNED CUSTOMERS • Historical churn from legacy platform provides SumTotal with a customer win back opportunity • Significant improvement in SumTotal’s NPS score after two critical platform upgrades 3 Of the world’s 10 largest airlines 3 Of the five largest U.S. life insurance companies 3 Of the largest U.S. banks 7 Of the world’s largest drug and biotech companies INDUSTRY LEADERS CHOOSE SUMTOTAL 48
DISCLAIMER 49 This document includes statements that are, or may be deemed to be, “forward - looking statements” within the meaning of Section 2 7A of the Securities Act of 1933, as amended, and Section 21E of the Securities Exchange Act of 1934, as amended, which are intended to be covered by the safe harbors created by those laws. These forward - looking statements include information about pos sible or assumed future results of our operations. All statements, other than statements of historical facts, that address ac tiv ities, events or developments that we expect or anticipate may occur in the future, including such things as our outlook, our produc t d evelopment and planning, our pipeline, future capital expenditures, financial results, the impact of regulatory changes, exis tin g and evolving business strategies and acquisitions and dispositions, demand for our services and competitive strengths, goals, the be nefits of new initiatives, growth of our business and operations, our ability to successfully implement our plans, strategies , o bjectives, expectations and intentions are forward - looking statements. Also, when we use words such as “may,” “will,” “would,” “anticipate, ” “believe,” “estimate,” “expect,” “intend,” “plan,” “projects,” “forecasts,” “seeks,” “outlook,” “target,” goals,” “probably ,” or similar expressions, we are making forward - looking statements. Such statements are based upon the current beliefs and expectations of Sk illsoft’s management and are subject to significant risks and uncertainties. Actual results may differ from those set forth i n t he forward - looking statements. All forward - looking disclosure is speculative by its nature. There are important risks, uncertainties, events and factors that could cause our actual results or performance to differ mat eri ally from those in the forward - looking statements contained in this document, including: failure to realize the benefits expected from the business combination; the impact of changes in consumer spending patterns, consumer preferences, local, regional and national economic conditions, cri me, weather, demographic trends and employee availability; the impact of the ongoing COVID - 19 pandemic on our business, operating results and financial condition; fluctuations in our future operating results; our ability to successfully identify and consummate acquisition opportunities; the demand for, and acceptance of, our products and for cloud - based technology learning solutions in general; our ability to compete successfully in competitive markets and changes in the competitive environment in our industry and the ma rkets in which we operate; our ability to market existing products and develop new products; a failure of our information technology infrastructure or any significant breach of security; the effects of pending and future legislation; future regulatory, judicial and legislative changes in our industry; the impact of natural disasters, public health crises, political crises, or other catastrophic events; our ability to attract and retain key employees and qualified technical and sales personnel; fluctuations in foreign currency exchange rates; our ability to protect or obtain intellectual property rights; our ability to raise additional capital; the impact of our indebtedness on our financial position and operating flexibility; and our ability to successfully defend ourselves in legal proceedings. The foregoing list of factors is not exhaustive and new factors may emerge from time to time that could also affect actual pe rfo rmance and results. For more information, please see the risk factors included in Churchill Capital Corp. II’s Annual Report on Form 10 - K/A for the year ended December 31, 2020 in Part I, Item 1A and in the registration statement on Form S - 4 filed by Churchill Cap ital Corp. II and declared effective by the Securities and Exchange Commission (the “SEC”) on May 27, 2021, and subsequent fi lin gs with the SEC. Although we believe that the assumptions underlying our forward - looking statements are reasonable, any of these assumptions, and therefore also the forward - looking statements based on these assumptions, could themselves prove to be inaccurate. Given the significant uncertainties inherent in the forward - looking statements included in this document, our inclusion of this informatio n is not a representation or guarantee by us that our objectives and plans will be achieved. Annualized, pro forma, projecte d a nd estimated numbers are used for illustrative purpose only, are not forecasts and may not reflect actual results. Our forward - looking statements speak only as of the date made and we will not update these forward - looking statements unless req uired by applicable law. With regard to these risks, uncertainties and assumptions, the forward - looking events discussed in this document may not occur, and we caution you against unduly relying on these forward - looking statements.