EX-99.2
Published on September 14, 2021
Exhibit 99.2
|
SEPTEMBER 2021 INVESTOR PRESENTATION |

|
DISCLAIMER FORWARD LOOKING STATEMENTS This document includes statements that are, or may be deemed to be, “forward-looking statements” within the meaning of Section 27A of the Securities Act of 1933, as amended, and Section 21E of the Securities Exchange Act of 1934, as amended, which are intended to be covered by the safe harbors created by those laws. These forward-looking statements include information about possible or assumed future results of our operations. All statements, other than statements of historical facts, that address activities, events or developments that we expect or anticipate may occur in the future, including such things as our outlook, our product development and planning, our pipeline, future capital expenditures, financial results, the impact of regulatory changes, existing and evolving business strategies and acquisitions and dispositions, demand for our services and competitive strengths, goals, the benefits of new initiatives, growth of our business and operations, our ability to successfully implement our plans, strategies, objectives, expectations and intentions are forward-looking statements. Also, when we use words such as “may,” “will,” “would,” “anticipate,” “believe,” “estimate,” “expect,” “intend,” “plan,” “projects,” “forecasts,” “seeks,” “outlook,” “target,” goals,” “probably,” or similar expressions, we are making forward-looking statements. Such statements are based upon the current beliefs and expectations of Skillsoft’s management and are subject to significant risks and uncertainties. Actual results may differ from those set forth in the forward-looking statements. All forward-looking disclosure is speculative by its nature. There are important risks, uncertainties, events and factors that could cause our actual results or performance to differ materially from those in the forward-looking statements contained in this document, including: • our ability to realize the benefits expected from the business combination between Skillsoft, Churchill Capital Corp. II and Global Knowledge; • the impact of changes in consumer spending patterns, consumer preferences, local, regional and national economic conditions, crime, weather, demographic trends and employee availability; • the impact of the ongoing COVID-19 pandemic on our business, operating results and financial condition; • fluctuations in our future operating results; • our ability to successfully identify, consummate and achieve strategic objectives in connection with our acquisition opportunities and realize the benefits expected from the acquisition; • the demand for, and acceptance of, our products and for cloud-based technology learning solutions in general; • our ability to compete successfully in competitive markets and changes in the competitive environment in our industry and the markets in which we operate; • our ability to market existing products and develop new products; • a failure of our information technology infrastructure or any significant breach of security; • the effects of pending and future legislation; • future regulatory, judicial and legislative changes in our industry; • our ability to comply with laws and regulations applicable to our business; • the impact of natural disasters, public health crises, political crises, or other catastrophic events; • our ability to attract and retain key employees and qualified technical and sales personnel; • fluctuations in foreign currency exchange rates; • our ability to protect or obtain intellectual property rights; • our ability to raise additional capital; • the impact of our indebtedness on our financial position and operating flexibility; and • our ability to successfully defend ourselves in legal proceedings; • our ability to remediate any material weaknesses or maintain effective internal controls over financial reporting; and • our ability to continue to meet applicable listing standards. The foregoing list of factors is not exhaustive and new factors may emerge from time to time that could also affect actual performance and results. For more information, please see the risk factors included in Churchill Capital Corp. II’s Annual Report on Form 10-K/A for the year ended December 31, 2020 in Part I, Item 1A and in the registration statement on Form S-4 filed by Churchill Capital Corp. II and declared effective by the Securities and Exchange Commission (the “SEC”) on May 27, 2021, and subsequent filings with the SEC. Although we believe that the assumptions underlying our forward-looking statements are reasonable, any of these assumptions, and therefore also the forward-looking statements based on these assumptions, could themselves prove to be inaccurate. Given the significant uncertainties inherent in the forward-looking statements included in this document, our inclusion of this information is not a representation or guarantee by us that our objectives and plans will be achieved. Annualized, pro forma, projected and estimated numbers are used for illustrative purpose only, are not forecasts and may not reflect actual results. Additionally, statements as to market share, industry data and our market position are based on the most currently available data available to us and our estimates regarding market position or other industry data included in this document or otherwise discussed by us involve risks and uncertainties and are subject to change based on various factors, including as set forth above. Our forward-looking statements speak only as of the date made and we will not update these forward-looking statements unless required by applicable law. With regard to these risks, uncertainties and assumptions, the forward-looking events discussed in this document may not occur, and we caution you against unduly relying on these forward-looking statements. 2 |
|
Introduction Strategy Finance Q&A VISION ‘To be the most highly valued provider of learning solutions, preparing the workforce of today with the skills for tomorrow.’ 3 |

|
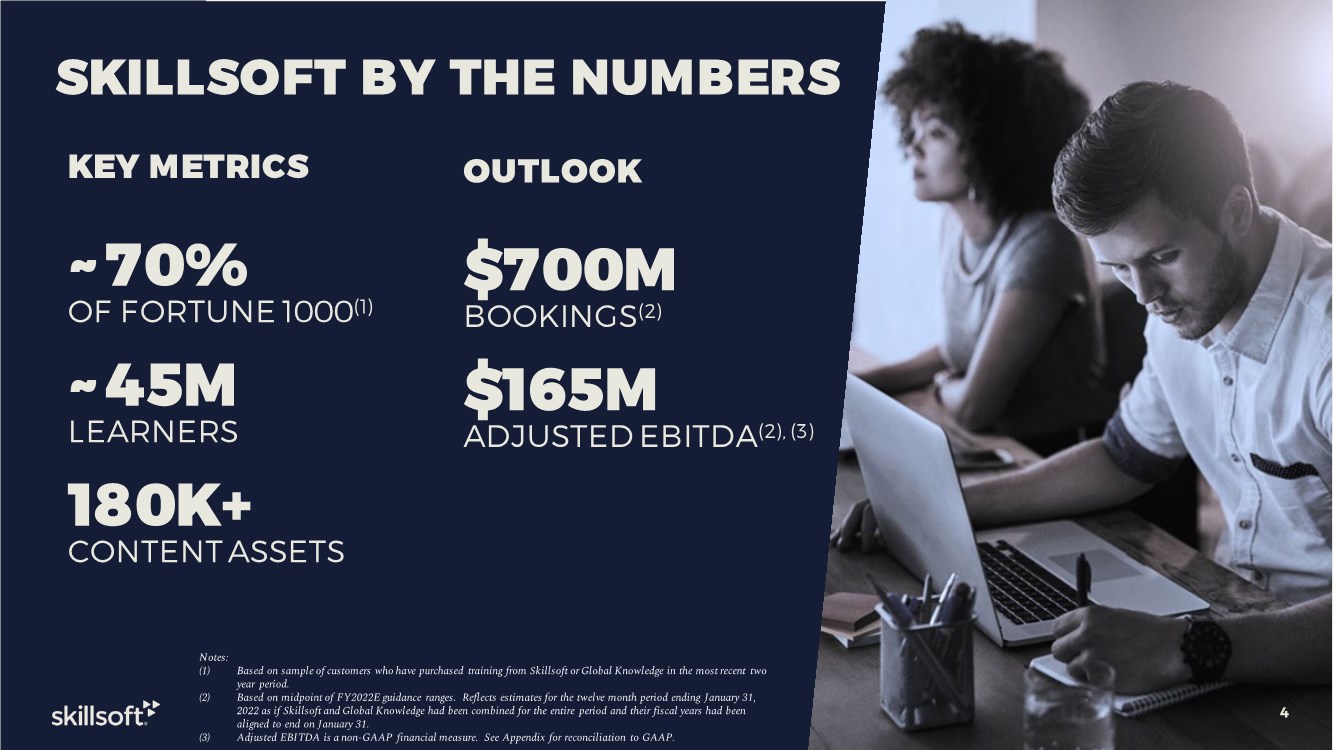
4 KEY METRICS ~70% OF FORTUNE 1000(1) ~45M LEARNERS 180K+ CONTENT ASSETS SKILLSOFT BY THE NUMBERS Notes: (1) Based on sample of customers who have purchased training from Skillsoft or Global Knowledge in the most recent two year period. (2) Based on midpoint of FY2022E guidance ranges. Reflects estimates for the twelve month period ending January 31, 2022 as if Skillsoft and Global Knowledge had been combined for the entire period and their fiscal years had been aligned to end on January 31. (3) Adjusted EBITDA is a non-GAAP financial measure. See Appendix for reconciliation to GAAP. 4 OUTLOOK $700M BOOKINGS(2) $165M ADJUSTED EBITDA(2), (3) |
|
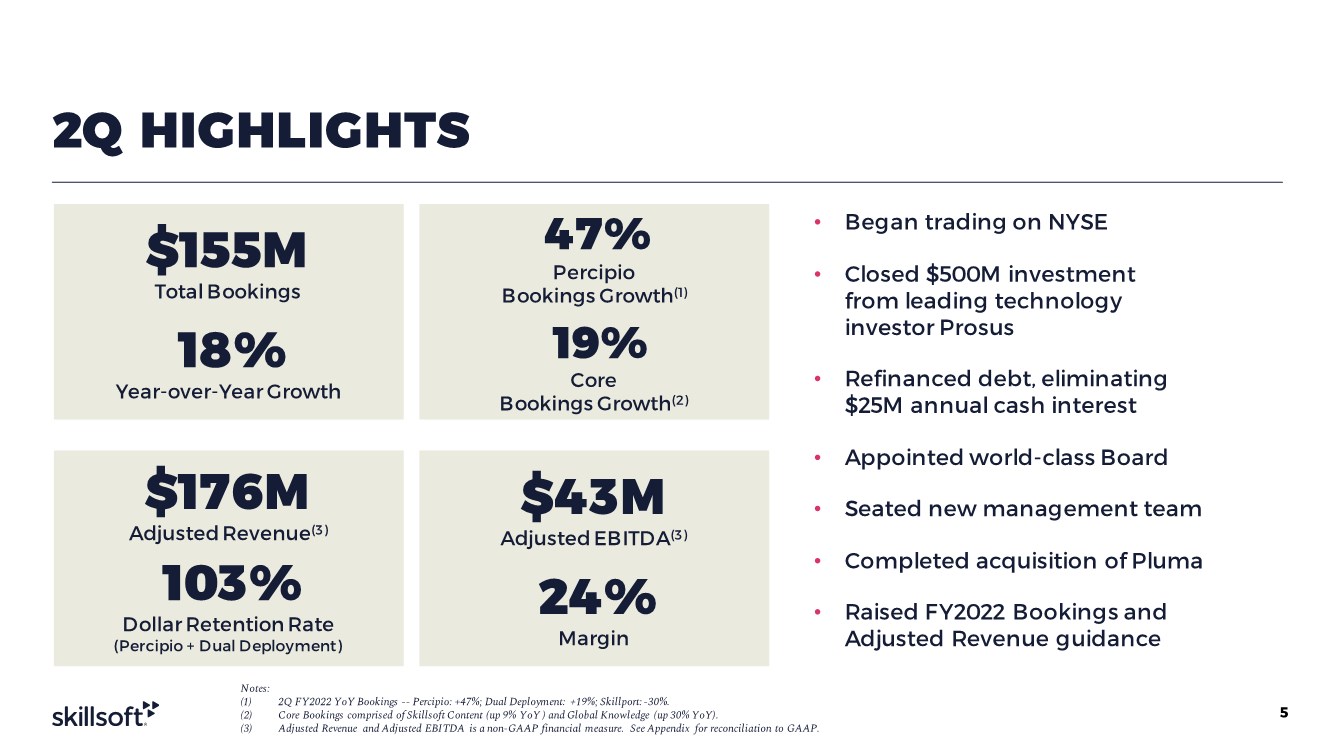
2Q HIGHLIGHTS $155M Total Bookings 18% Year-over-Year Growth 47% Percipio Bookings Growth(1) 19% Core Bookings Growth(2) $176M Adjusted Revenue(3) 103% Dollar Retention Rate (Percipio + Dual Deployment) $43M Adjusted EBITDA(3) 24% Margin • Began trading on NYSE • Closed $500M investment from leading technology investor Prosus • Refinanced debt, eliminating $25M annual cash interest • Appointed world-class Board • Seated new management team • Completed acquisition of Pluma • Raised FY2022 Bookings and Adjusted Revenue guidance 5 Notes: (1) 2Q FY2022 YoY Bookings -- Percipio: +47%; Dual Deployment: +19%; Skillport: -30%. (2) Core Bookings comprised of Skillsoft Content (up 9% YoY ) and Global Knowledge (up 30% YoY). (3) Adjusted Revenue and Adjusted EBITDA is a non-GAAP financial measure. See Appendix for reconciliation to GAAP. |
|
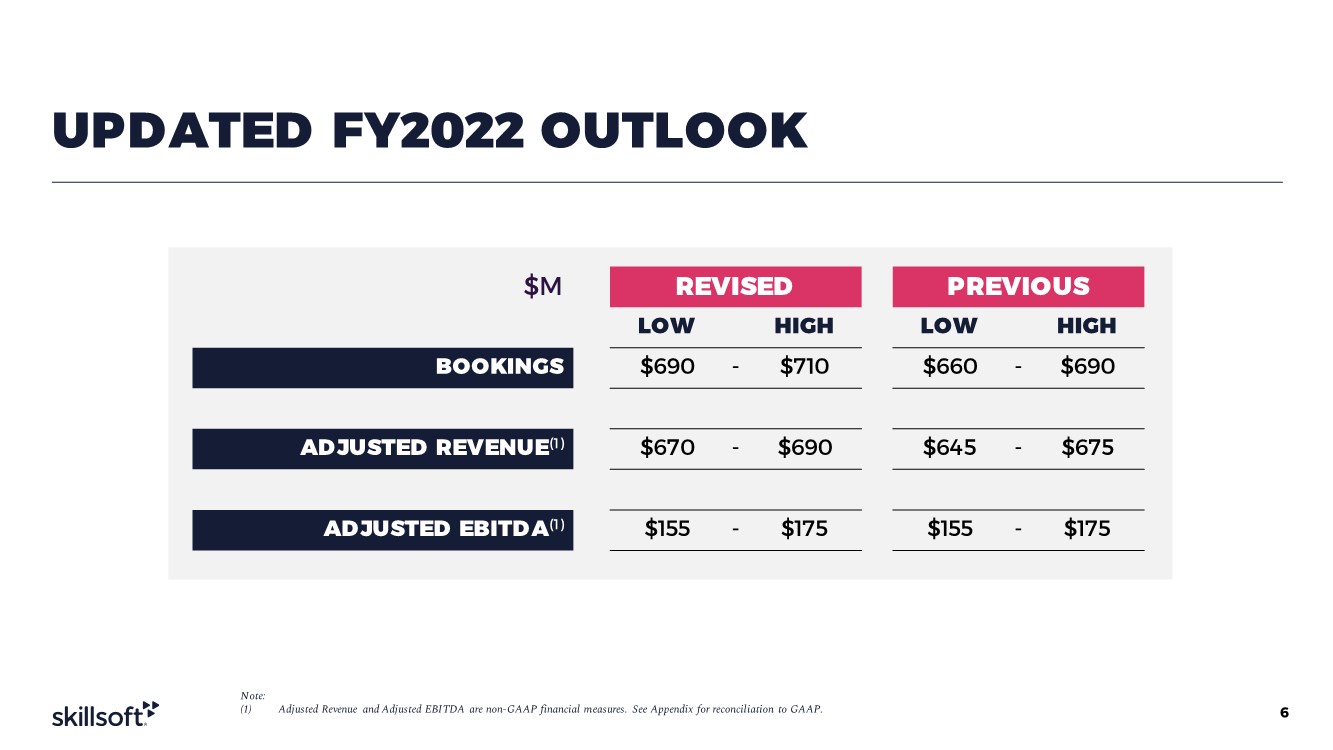
UPDATED FY2022 OUTLOOK 6 Note: (1) Adjusted Revenue and Adjusted EBITDA are non-GAAP financial measures. See Appendix for reconciliation to GAAP. $M REVISED PREVIOUS LOW HIGH LOW HIGH BOOKINGS $690 - $710 $660 - $690 AD JUSTED REVENUE(1) $670 - $690 $645 - $675 ADJUSTED EBITDA(1) $155 - $175 $155 - $175 |
|
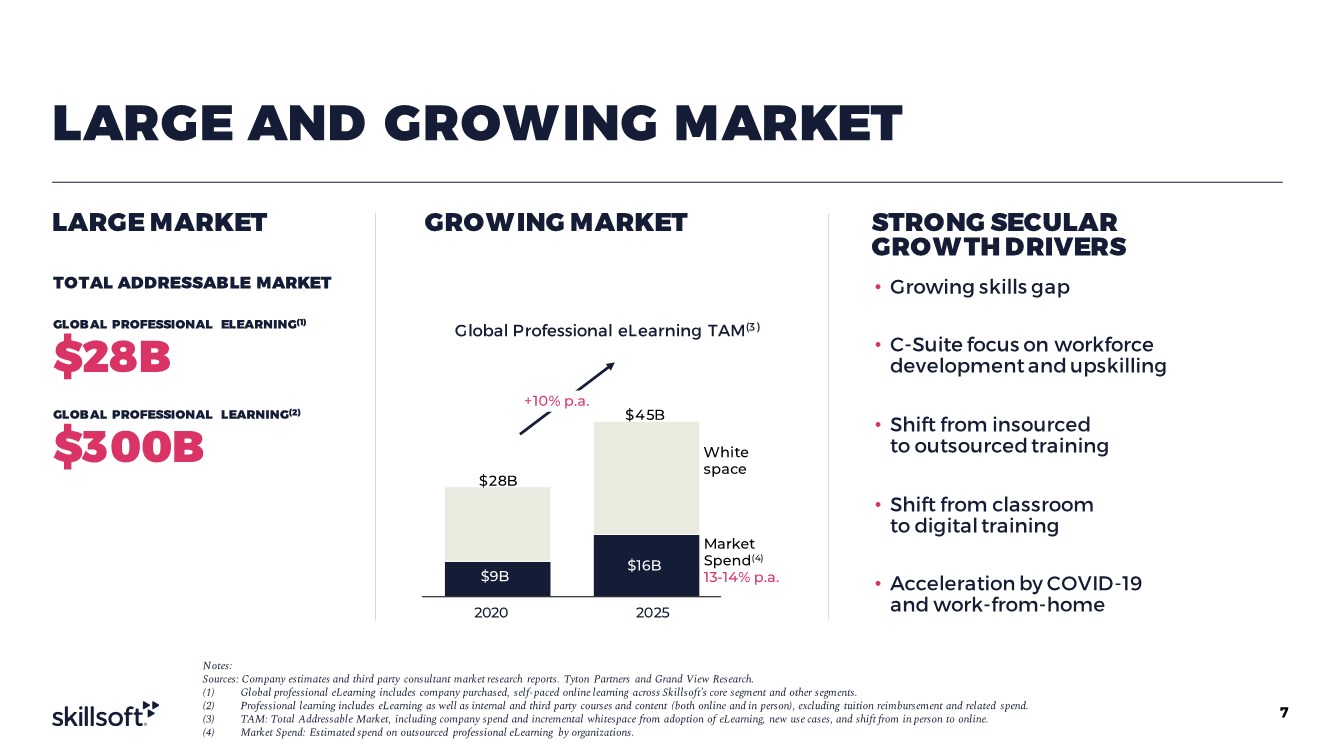
LARGE AND GROWING MARKET LARGE MARKET GROWING MARKET STRONG SECULAR GROWTH DRIVERS • Growing skills gap • C-Suite focus on workforce development and upskilling • Shift from insourced to outsourced training • Shift from classroom to digital training • Acceleration by COVID-19 and work-from-home TOTAL ADDRESSABLE MARKET GLOBAL PROFESSIONAL ELEARNING(1) $28B GLOBAL PROFESSIONAL LEARNING(2) $300B Global Professional eLearning TAM(3) $9B $16B 2020 2025 +10% p.a. White space Market Spend(4) 13-14% p.a. $28B $4 5B 7 Notes: Sources: Company estimates and third party consultant market research reports. Tyton Partners and Grand View Research. (1) Global professional eLearning includes company purchased, self-paced online learning across Skillsoft’s core segment and other segments. (2) Professional learning includes eLearning as well as internal and third party courses and content (both online and in person), excluding tuition reimbursement and related spend. (3) TAM: Total Addressable Market, including company spend and incremental whitespace from adoption of eLearning, new use cases, and shift from in person to online. (4) Market Spend: Estimated spend on outsourced professional eLearning by organizations. |
|
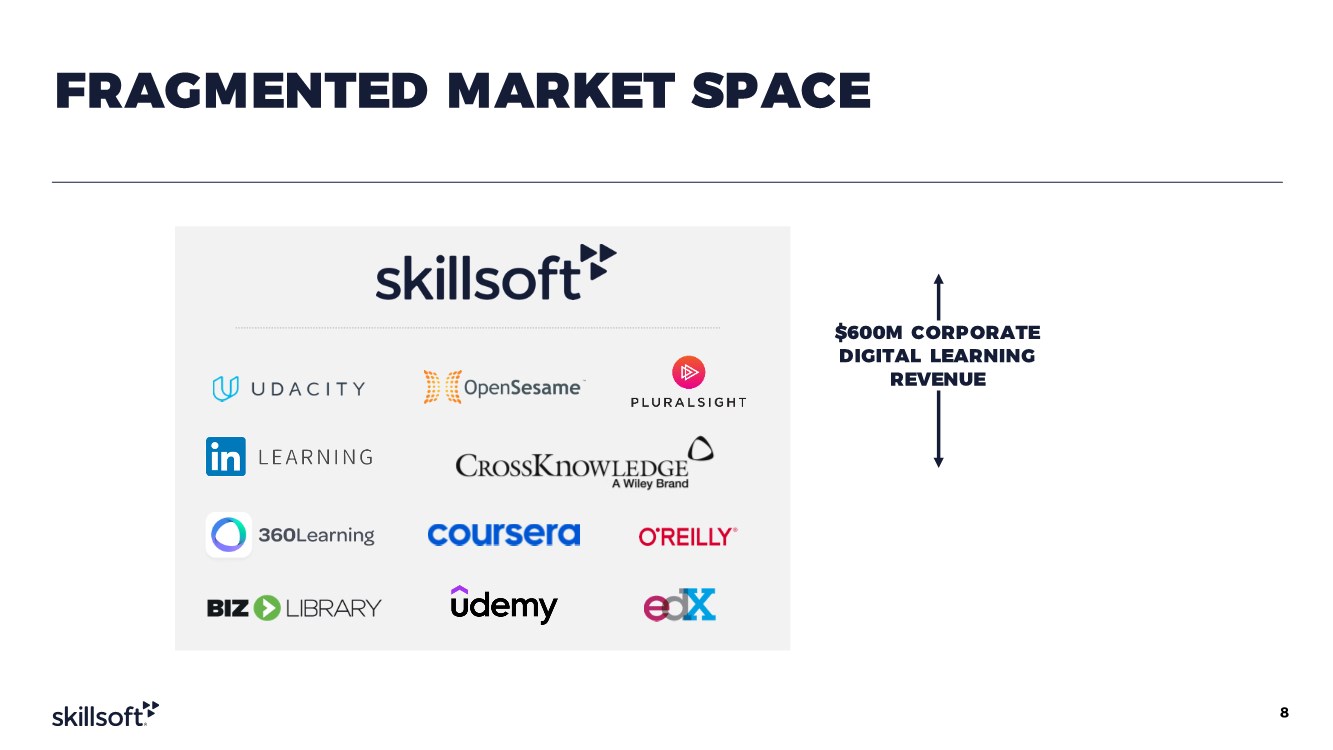
FRAGMENTED MARKET SPACE $600M CORPORATE DIGITAL LEARNING REVENUE 8 |
|
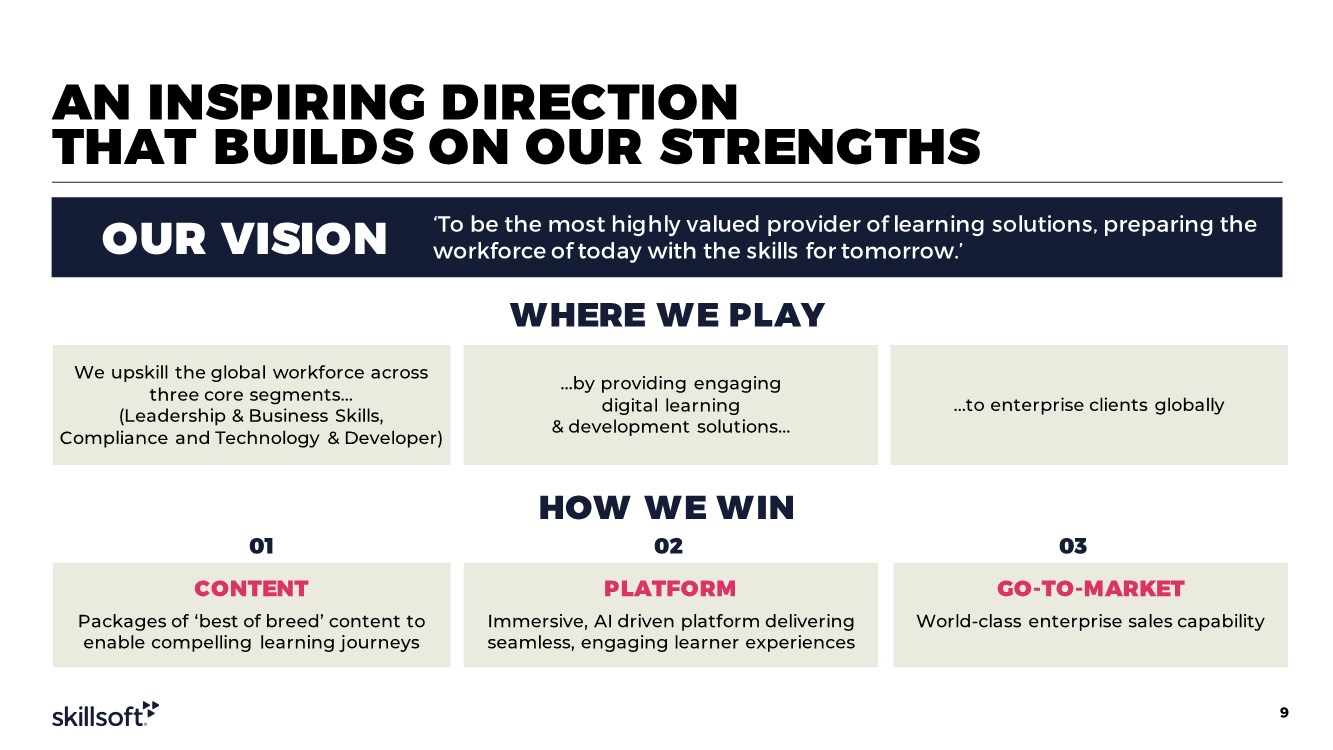
AN INSPIRING DIRECTION THAT BUILDS ON OUR STRENGTHS WHERE WE PLAY We upskill the global workforce across three core segments… (Leadership & Business Skills, Compliance and Technology & Developer) …by providing engaging digital learning & development solutions… …to enterprise clients globally ‘To be the most highly valued provider of learning solutions, preparing the workforce of today with the skills for tomorrow.’ HOW WE WIN CONTENT Packages of ‘best of breed’ content to enable compelling learning journeys PLATFORM Immersive, AI driven platform delivering seamless, engaging learner experiences GO-TO-MARKET World-class enterprise sales capability 01 02 03 OUR VISION 9 |
|
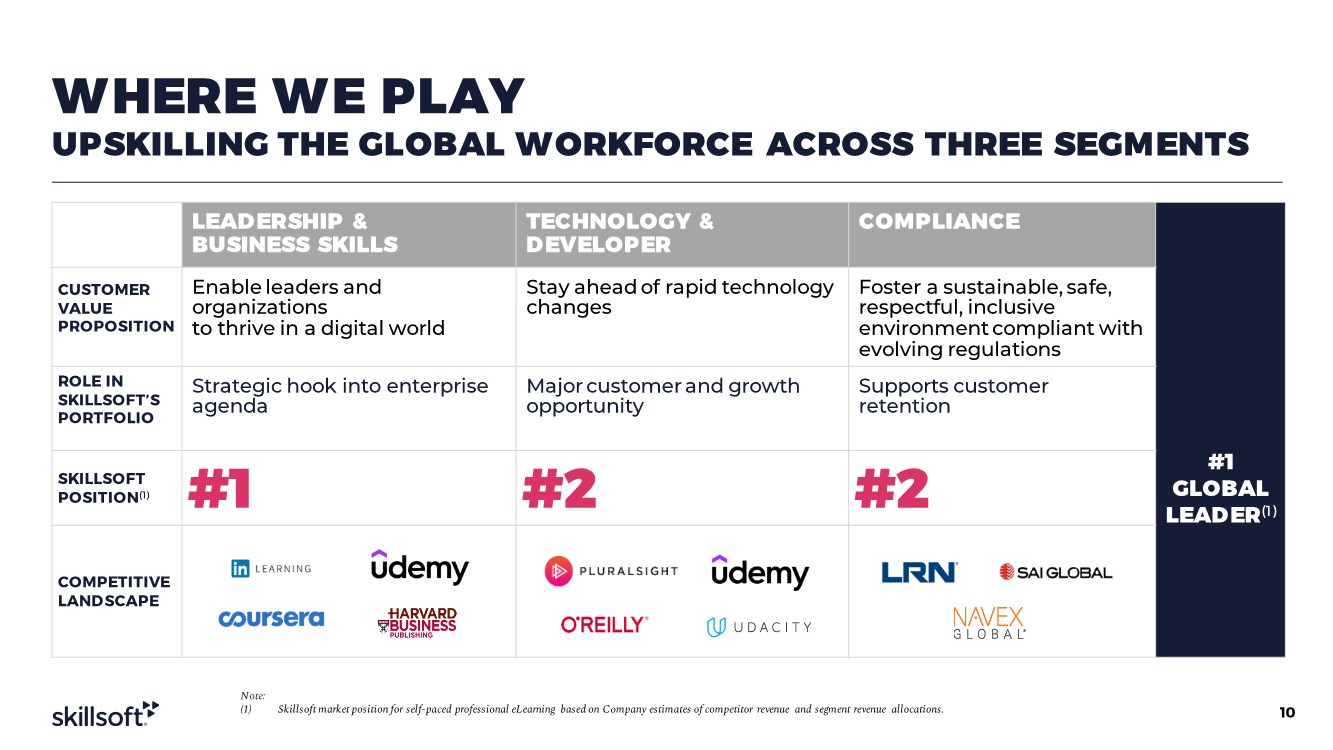
WHERE WE PLAY UPSKILLING THE GLOBAL WORKFORCE ACROSS THREE SEGMENTS LEAD ERSHIP & BUSINESS SKILLS TECHNOLOGY & D EVELOPER COMPLIANCE CUSTOMER VALUE PROPOSITION Enable leaders and organizations to thrive in a digital world Stay ahead of rapid technology changes Foster a sustainable, safe, respectful, inclusive environment compliant with evolving regulations ROLE IN SKILLSOFT’S PORTFOLIO Strategic hook into enterprise agenda Major customer and growth opportunity Supports customer retention SKILLSOFT POSITION(1) #1 #2 #2 COMPETITIVE LANDSCAPE 10 Note: (1) Skillsoft market position for self-paced professional eLearning based on Company estimates of competitor revenue and segment revenue allocations. #1 GLOBAL LEAD ER(1) |
|
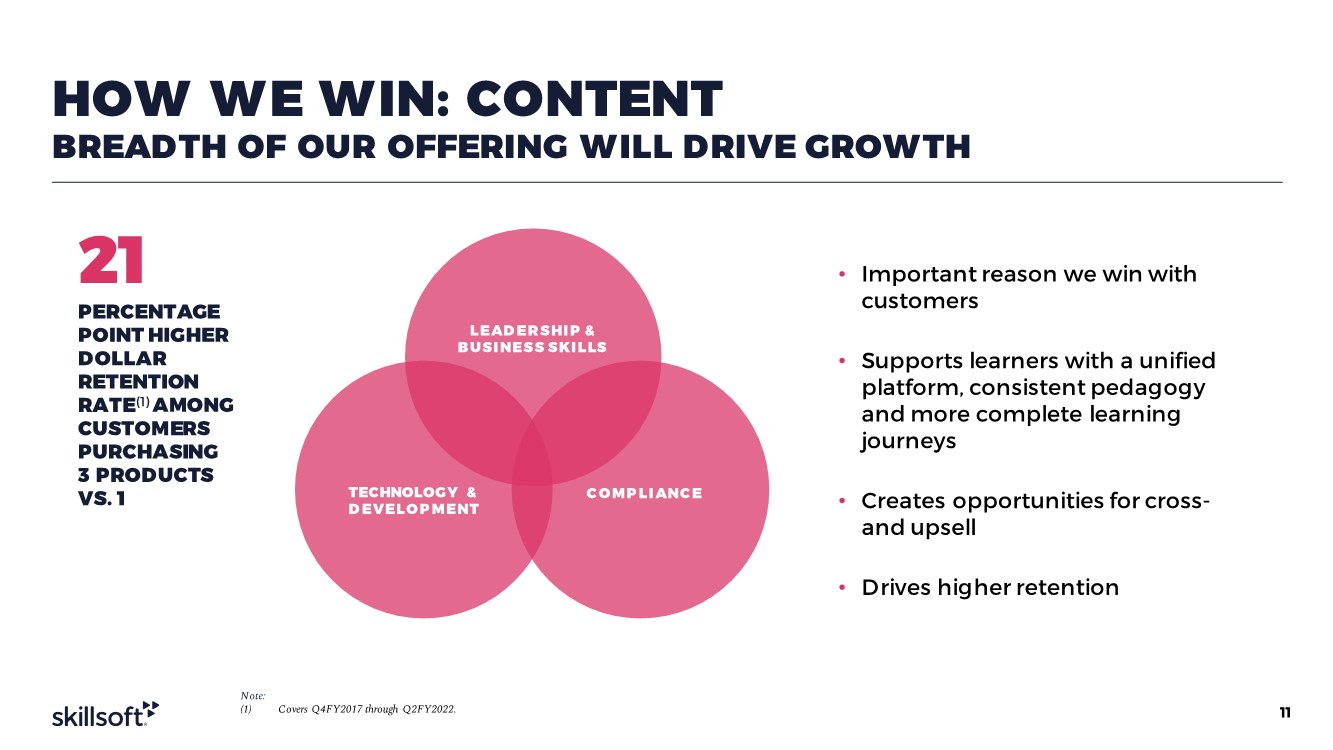
HOW WE WIN: CONTENT BREADTH OF OUR OFFERING WILL DRIVE GROWTH • Important reason we win with customers • Supports learners with a unified platform, consistent pedagogy and more complete learning journeys • Creates opportunities for cross- and upsell • Drives higher retention 21 PERCENTAGE POINT HIGHER DOLLAR RETENTION RATE(1) AMONG CUSTOMERS PURCHASING 3 PRODUCTS VS. 1 LEADERSHIP & BUSINESS SKILLS TECHNOLOGY & DEVELOPMENT COMPLIANCE 11 Note: (1) Covers Q4FY2017 through Q2FY2022. |
|
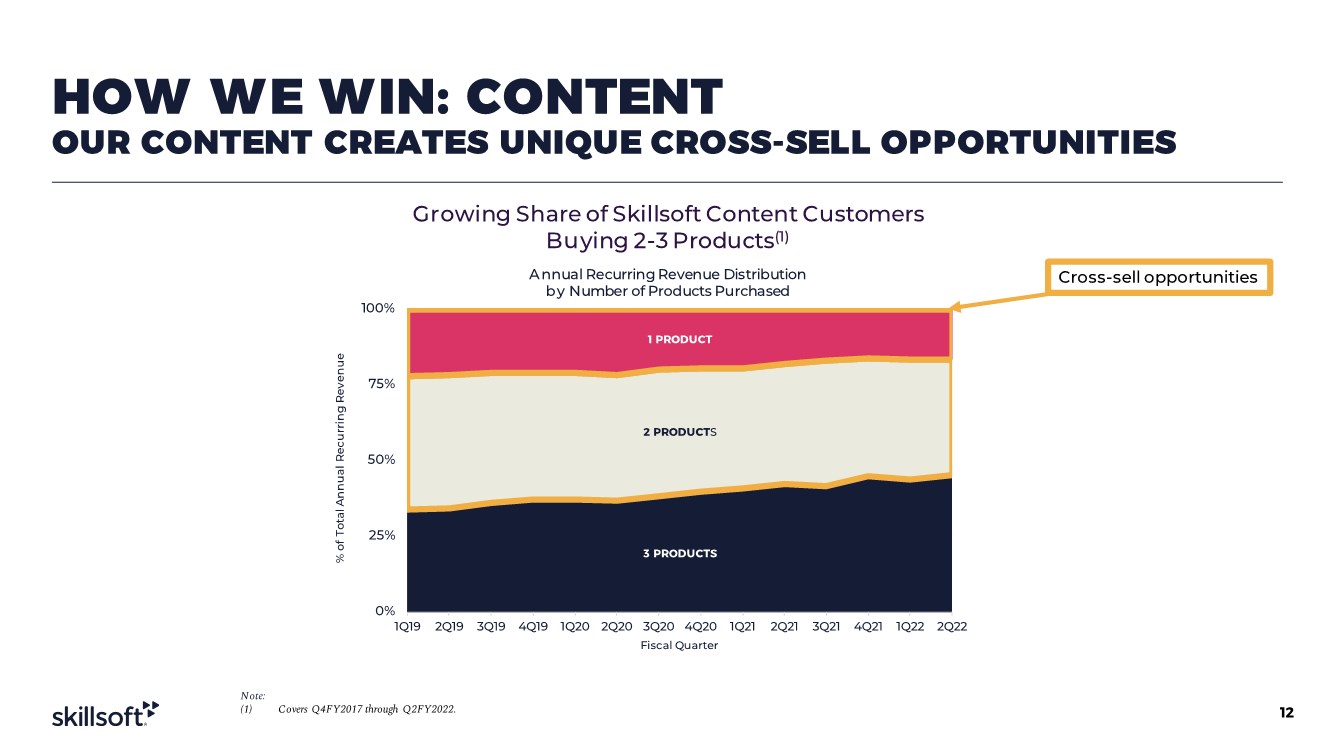
HOW WE WIN: CONTENT OUR CONTENT CREATES UNIQUE CROSS-SELL OPPORTUNITIES Growing Share of Skillsoft Content Customers Buying 2-3 Products(1) A nnual Recurring Revenue Distribution by Number of Products Purchased 3 PRODUCTS 2 PRODUCTS 1 PRODUCT 0% 25% 50% 75% 100% 1Q19 2Q19 3Q19 4Q19 1Q20 2Q20 3Q20 4Q20 1Q21 2Q21 3Q21 4Q21 1Q22 2Q22 % of Total Annual Recurring Revenue Fiscal Quarter Cross-sell opportunities 12 Note: (1) Covers Q4FY2017 through Q2FY2022. |
|
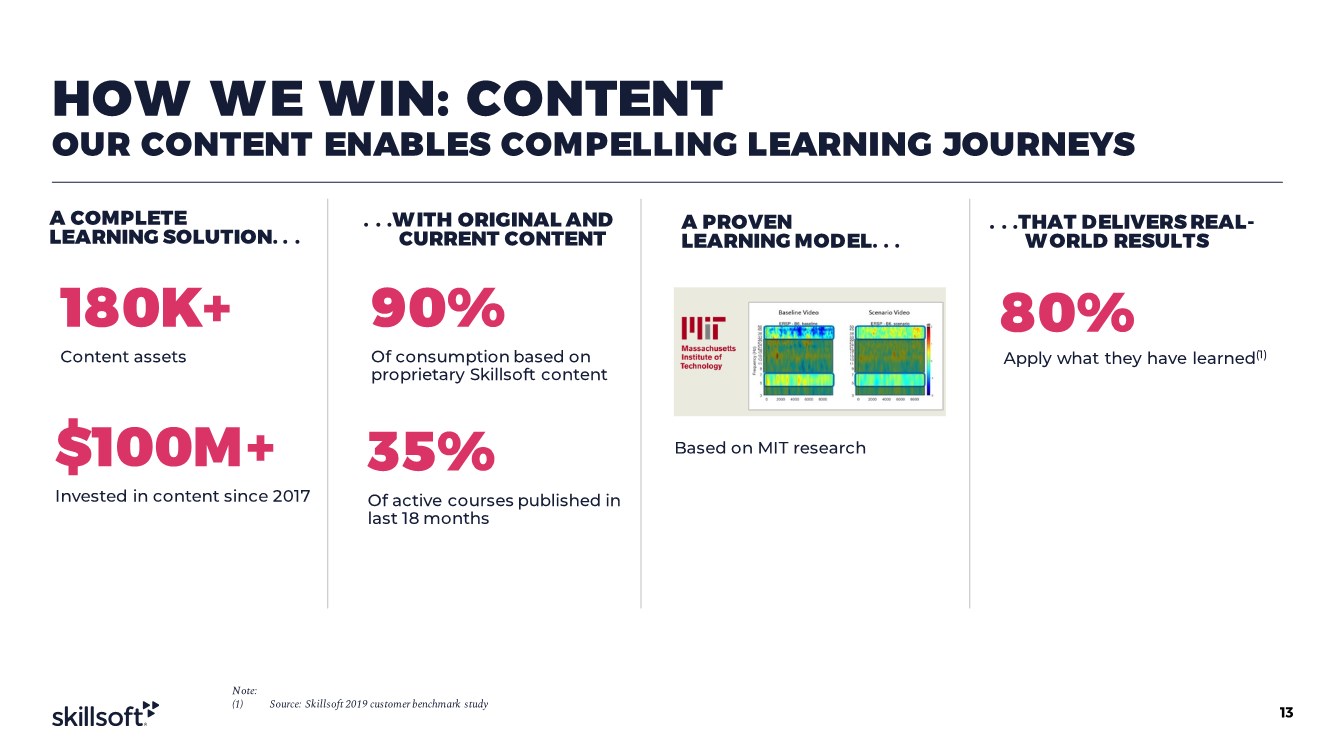
HOW WE WIN: CONTENT OUR CONTENT ENABLES COMPELLING LEARNING JOURNEYS .. . .WITH ORIGINAL AND CURRENT CONTENT A PROVEN LEARNING MODEL. . . .. . .THAT DELIVERS REAL- WORLD RESULTS 90% Of consumption based on proprietary Skillsoft content Based on MIT research Apply what they have learned(1) 35% Of active courses published in last 18 months 80% A COMPLETE LEARNING SOLUTION. . . 180K+ Content assets $100M+ Invested in content since 2017 13 Note: (1) Source: Skillsoft 2019 customer benchmark study |
|
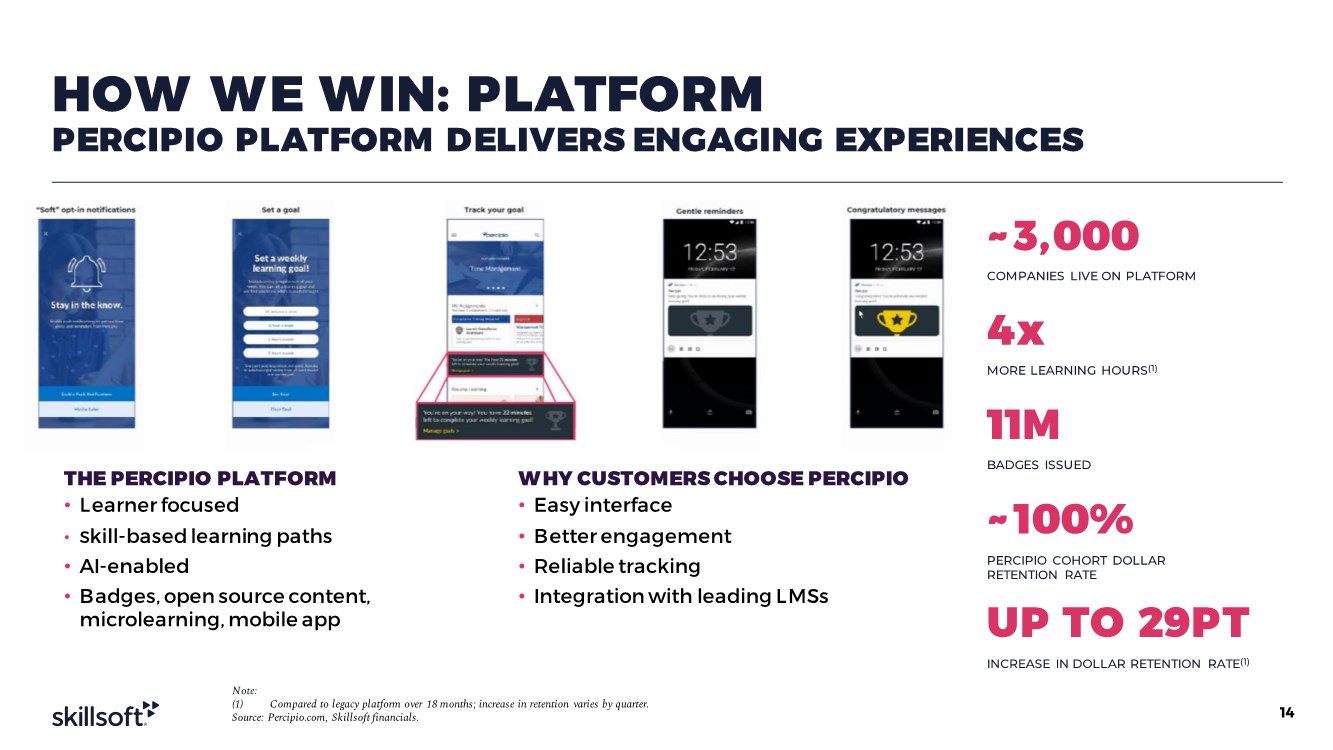
HOW WE WIN: PLATFORM PERCIPIO PLATFORM DELIVERS ENGAGING EXPERIENCES ~ 3,000 COMPANIES LIVE ON PLATFORM 4x MORE LEARNING HOURS(1) 11M BADGES ISSUED ~ 100% PERCIPIO COHORT DOLLAR RETENTION RATE UP TO 29PT INCREASE IN DOLLAR RETENTION RATE(1) THE PERCIPIO PLATFORM • Learner focused • Skill-based learning paths • AI-enabled • Badges, open source content, microlearning, mobile app WHY CUSTOMERS CHOOSE PERCIPIO • Easy interface • Better engagement • Reliable tracking • Integration with leading LMSs 14 Note: (1) Compared to legacy platform over 18 months; increase in retention varies by quarter. Source: Percipio.com, Skillsoft financials. |
|
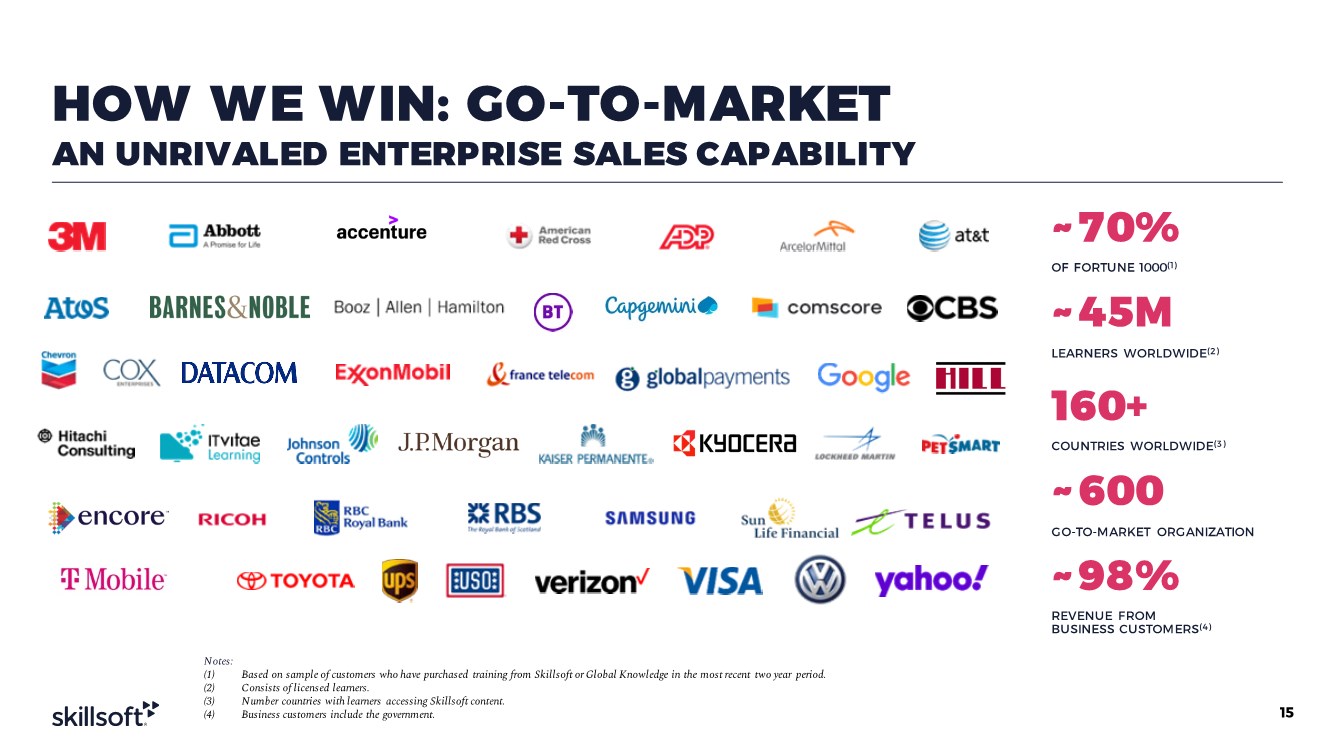
~ 70% OF FORTUNE 1000(1) ~45M LEARNERS WORLDWIDE(2) 160+ COUNTRIES WORLDWIDE(3) ~ 600 GO-TO-MARKET ORGANIZATION ~98% REVENUE FROM BUSINESS CUSTOMERS(4) HOW WE WIN: GO-TO-MARKET AN UNRIVALED ENTERPRISE SALES CAPABILITY 15 Notes: (1) Based on sample of customers who have purchased training from Skillsoft or Global Knowledge in the most recent two year period. (2) Consists of licensed learners. (3) Number countries with learners accessing Skillsoft content. (4) Business customers include the government. |
|
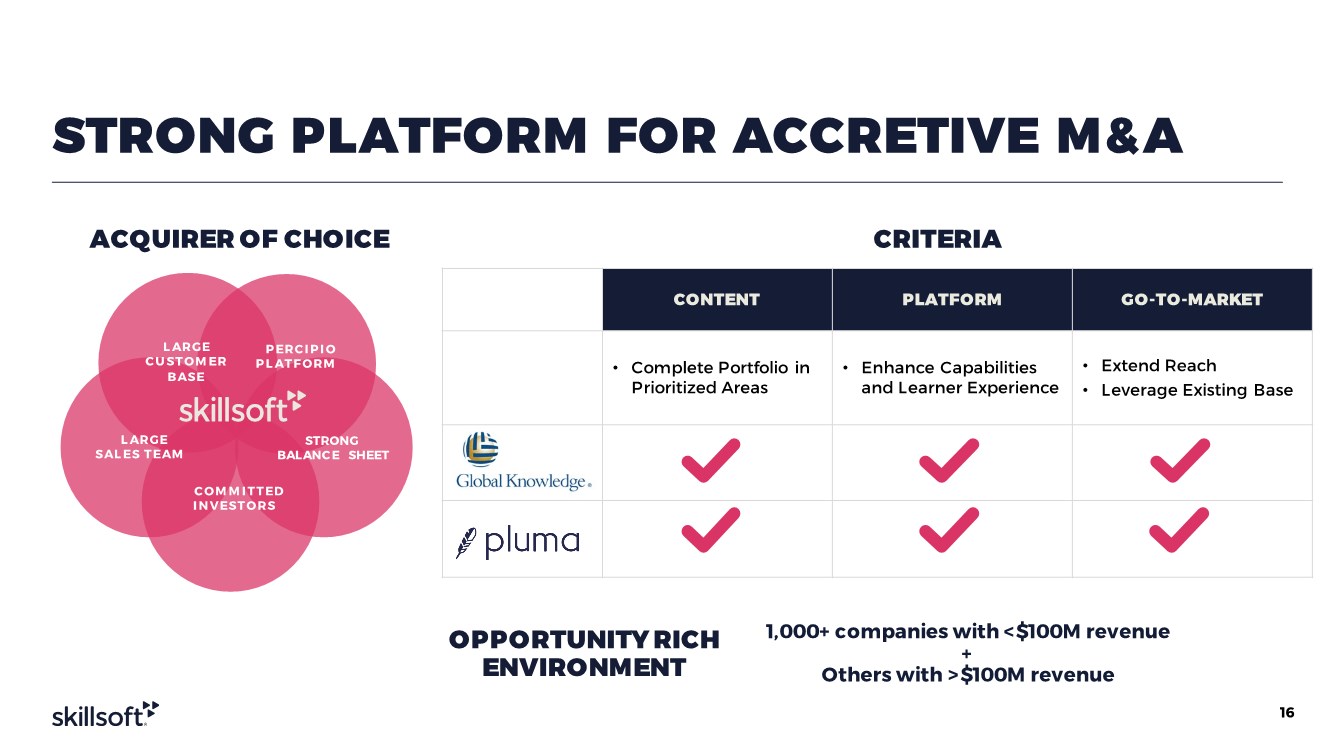
STRONG PLATFORM FOR ACCRETIVE M&A 16 PERCIPIO PLATFORM LARGE SALES TEAM LARGE CUSTOMER BASE STRONG BALANC E SHEET COMMITTED INVESTORS ACQUIRER OF CHOICE 1,000+ companies with <$100M revenue + Others with >$100M revenue CRITERIA OPPORTUNITY RICH ENVIRONMENT CONTENT PLATFORM GO-TO-MARKET • Complete Portfolio in Prioritized Areas • Enhance Capabilities and Learner Experience • Extend Reach • Leverage Existing Base |
|
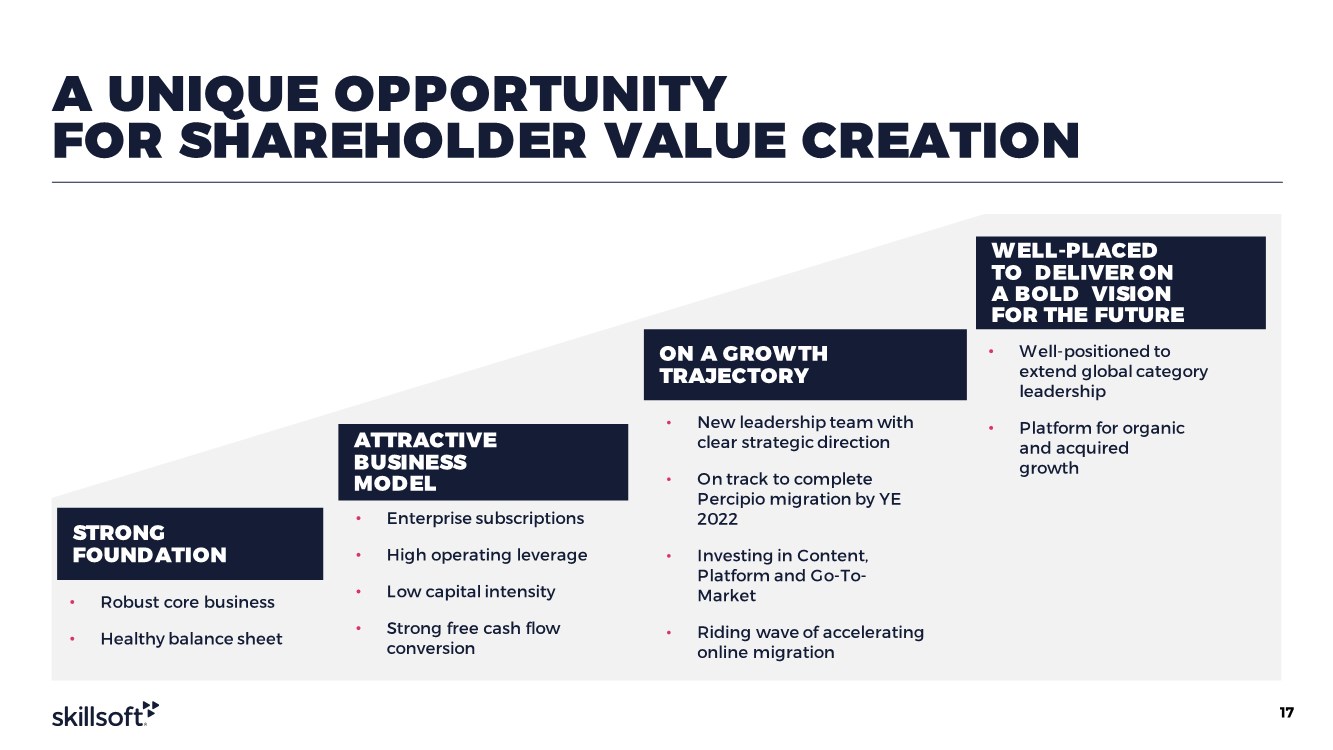
A UNIQUE OPPORTUNITY FOR SHAREHOLDER VALUE CREATION ATTRACTIVE BUSINESS MODEL • Enterprise subscriptions • High operating leverage • Low capital intensity • Strong free cash flow conversion ON A GROWTH TRAJECTORY • New leadership team with clear strategic direction • On track to complete Percipio migration by YE 2022 • Investing in Content, Platform and Go-To- Market • Riding wave of accelerating online migration WELL-PLACED TO DELIVER ON A BOLD VISION FOR THE FUTURE • Well-positioned to extend global category leadership • Platform for organic and acquired growth STRONG FOUNDATION • Robust core business • Healthy balance sheet 17 |
|
Positioned for profitable growth High level of subscription renewal Operating leverage High cash flow conversion Attractive capital structure ATTRACTIVE FINANCIAL PROFILE 18 #1 #2 #3 #4 #5 |
|
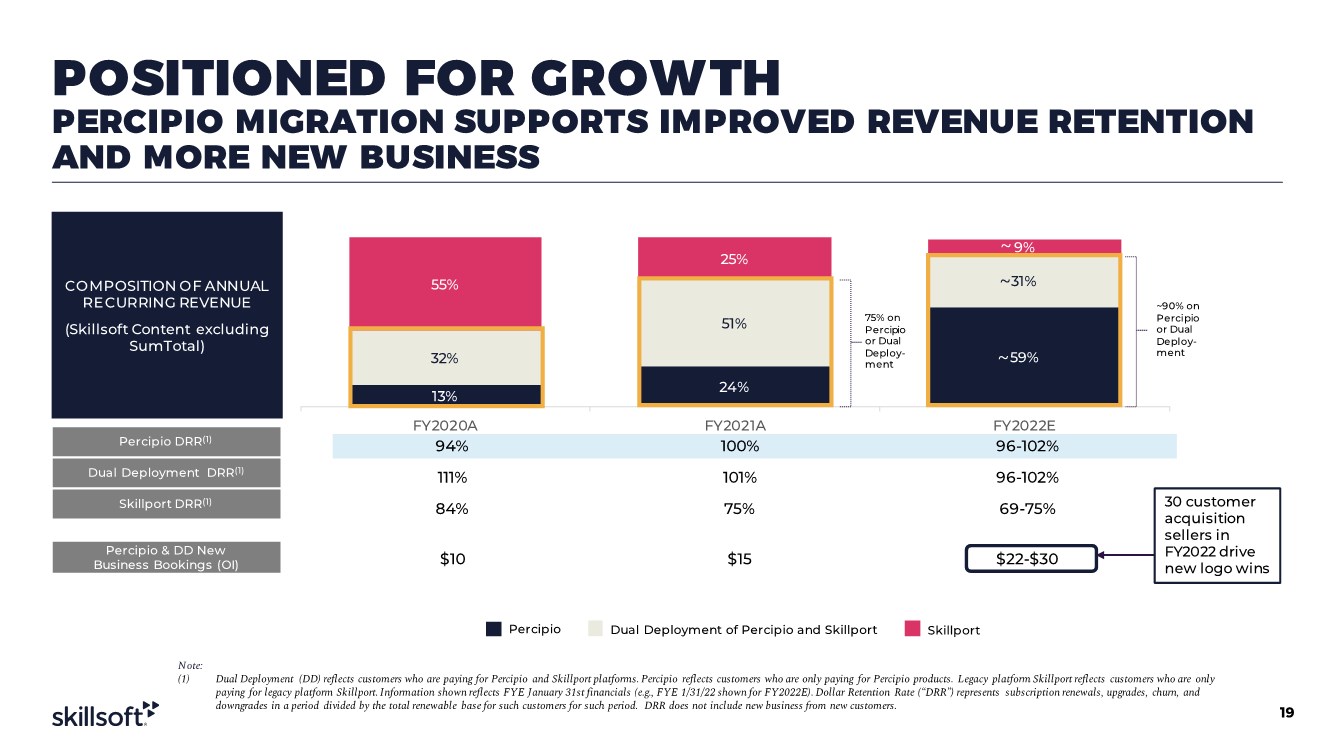
POSITIONED FOR GROWTH PERCIPIO MIGRATION SUPPORTS IMPROVED REVENUE RETENTION AND MORE NEW BUSINESS 13% 24% 59% 32% 51% 31% 55% 25% 9% FY2020A FY2021A FY2022E 94% 100% 96-102% 111% 101% 96-102% 84% 75% 69-75% $10 $15 $22-$30 COMPOSITION OF ANNUAL RE CURRING REVENUE (Skillsoft Content excluding SumTotal) Percipio DRR(1) Dual Deployment DRR(1) Skillport DRR(1) Percipio & DD New Business Bookings (OI) ~ ~ ~ ~ ~ ~ 75% on Percipio or Dual Deploy- ment ~90% on Percipio or Dual Deploy- ment 30 customer acquisition sellers in FY2022 drive new logo wins 19 Note: (1) Dual Deployment (DD) reflects customers who are paying for Percipio and Skillportplatforms. Percipio reflects customers who are only paying for Percipio products. Legacy platform Skillportreflects customers who are only paying for legacy platform Skillport. Information shown reflects FYE January 31st financials (e.g., FYE 1/31/22 shown for FY2022E). Dollar Retention Rate (“DRR”) represents subscription renewals, upgrades, churn, and downgrades in a period divided by the total renewable base for such customers for such period. DRR does not include new business from new customers. Dual Deployment of Percipio and Skillport Skillport Percipio |
|
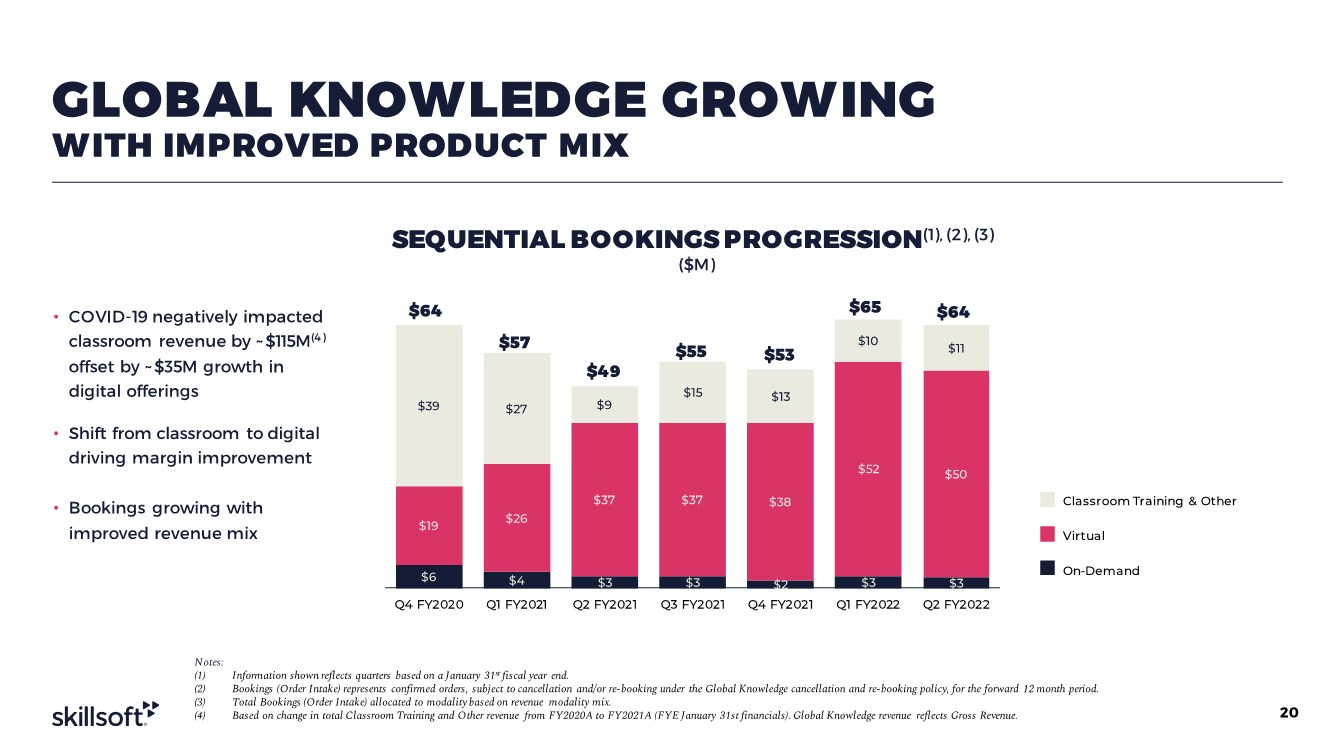
GLOBAL KNOWLEDGE GROWING WITH IMPROVED PRODUCT MIX • COVID-19 negatively impacted classroom revenue by ~$115M(4) offset by ~$35M growth in digital offerings • Shift from classroom to digital driving margin improvement • Bookings growing with improved revenue mix SEQUENTIAL BOOKINGSPROGRESSION(1), (2), (3) ($M) $6 $4 $3 $3 $2 $3 $3 $19 $26 $37 $37 $38 $52 $50 $39 $27 $9 $15 $13 $10 $11 Q4 FY2020 Q1 FY2021 Q2 FY2021 Q3 FY2021 Q4 FY2021 Q1 FY2022 Q2 FY2022 $64 $57 $49 $53 $55 $65 $64 20 Notes: (1) Information shown reflects quarters based on a January 31st fiscal year end. (2) Bookings (Order Intake) represents confirmed orders, subject to cancellation and/or re-booking under the Global Knowledge cancellation and re-booking policy, for the forward 12 month period. (3) Total Bookings (Order Intake) allocated to modality based on revenue modality mix. (4) Based on change in total Classroom Training and Other revenue from FY2020A to FY2021A (FYE January 31st financials). Global Knowledge revenue reflects Gross Revenue. Classroom Training & Other Virtual On-Demand |
|
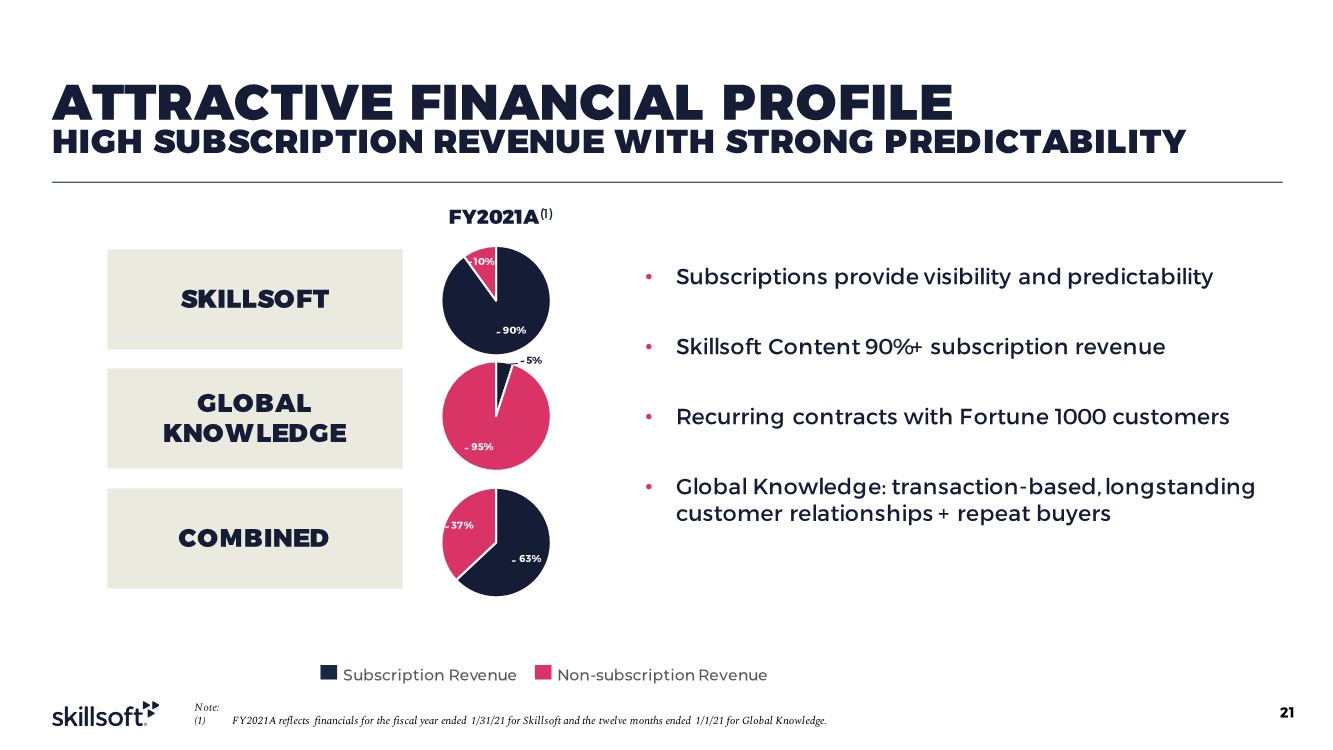
ATTRACTIVE FINANCIAL PROFILE HIGH SUBSCRIPTION REVENUE WITH STRONG PREDICTABILITY 21 Subscription Revenue Non-subscription Revenue Note: (1) FY2021A reflects financials for the fiscal year ended 1/31/21 for Skillsoft and the twelve months ended 1/1/21 for Global Knowledge. • Subscriptions provide visibility and predictability • Skillsoft Content 90%+ subscription revenue • Recurring contracts with Fortune 1000 customers • Global Knowledge: transaction-based, longstanding customer relationships + repeat buyers SKILLSOFT GLOBAL KNOW LEDGE COMBINED FY2021A(1) 90% 10% 5% 95% ~ ~ ~ ~ 63% 37% ~ ~ |
|
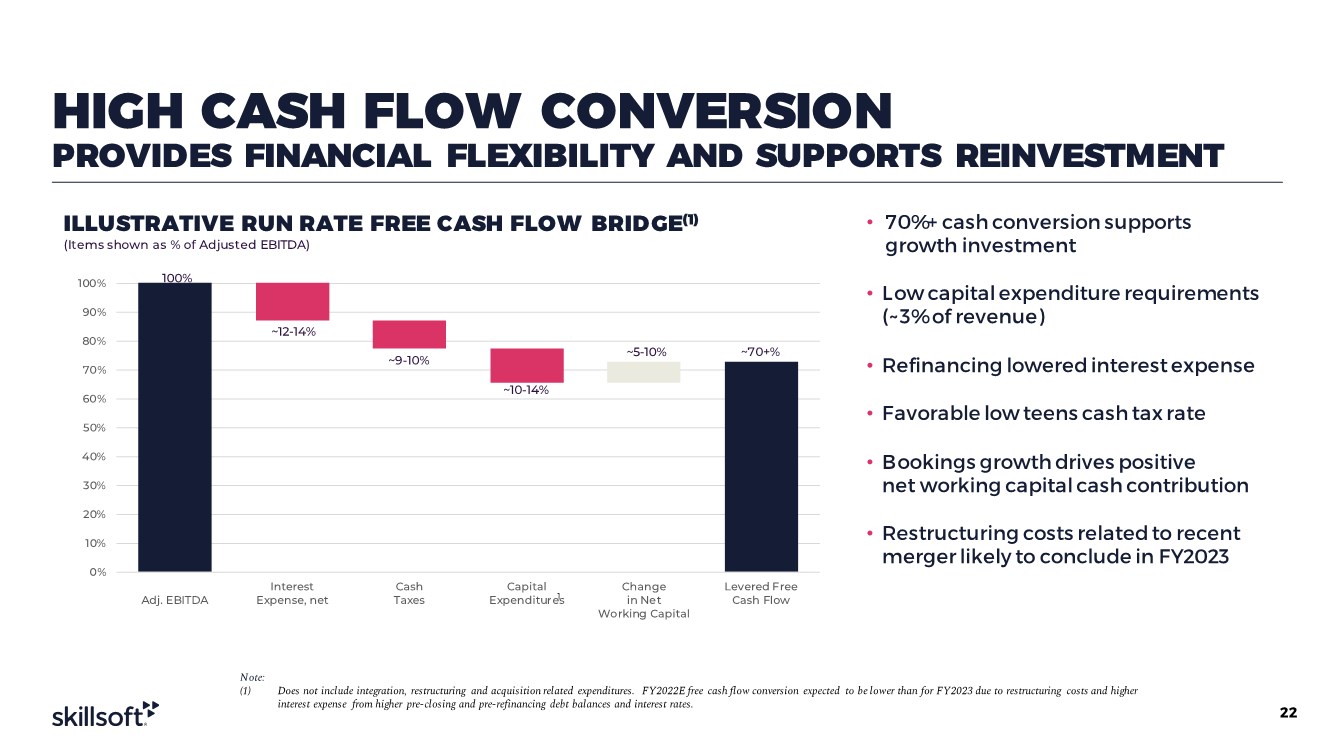
HIGH CASH FLOW CONVERSION PROVIDES FINANCIAL FLEXIBILITY AND SUPPORTS REINVESTMENT ILLUSTRATIVE RUN RATE FREE CASH FLOW BRIDGE(1) (Items shown as % of Adjusted EBITDA) • 70%+ cash conversion supports growth investment • Low capital expenditure requirements (~3% of revenue) • Refinancing lowered interest expense • Favorable low teens cash tax rate • Bookings growth drives positive net working capital cash contribution • Restructuring costs related to recent merger likely to conclude in FY2023 100% ~70+% ~12-14% ~9-10% ~10-14% ~5-10% 0% 10% 20% 30% 40% 50% 60% 70% 80% 90% 100% Adj. EBITDA Interest Expense, net Cash Taxes Capital Expenditures Change in Net Working Capital Levered Free Cash Flow 1 22 Note: (1) Does not include integration, restructuring and acquisition related expenditures. FY2022E free cash flow conversion expected to be lower than for FY2023 due to restructuring costs and higher interest expense from higher pre-closing and pre-refinancing debt balances and interest rates. |
|
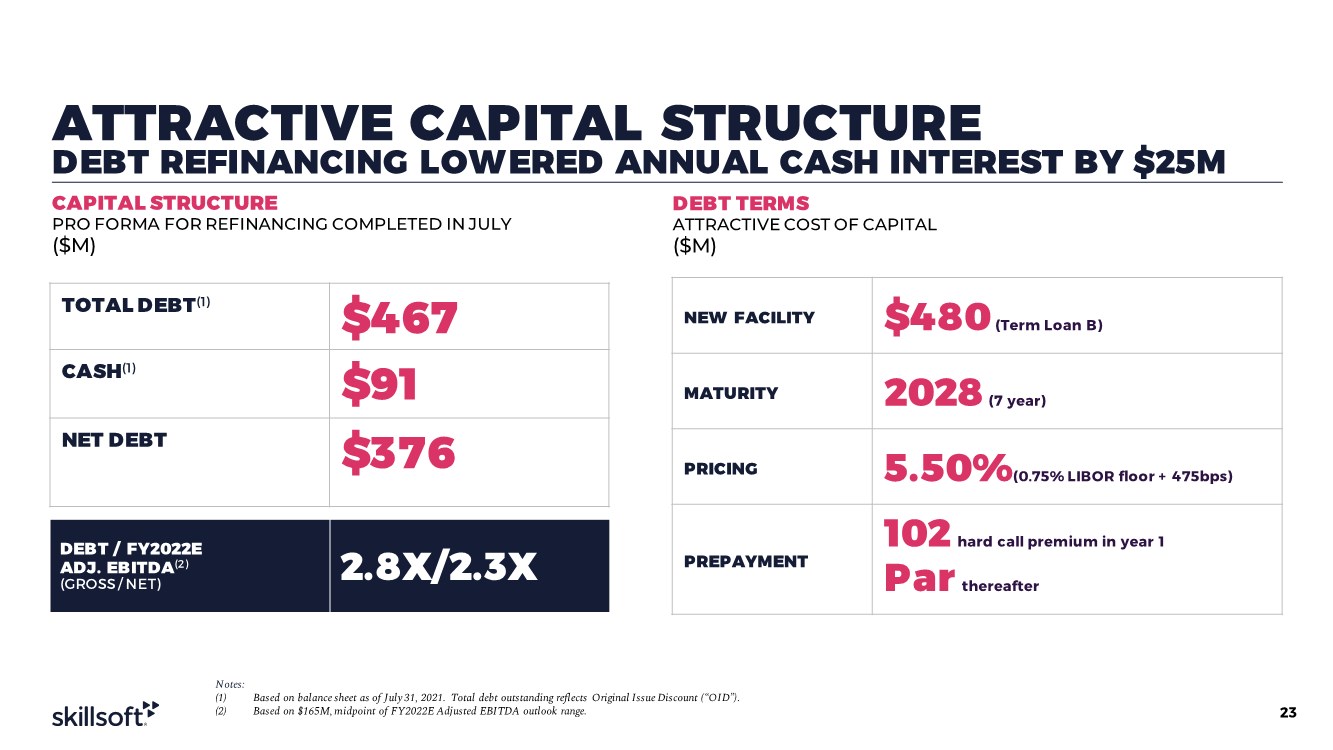
ATTRACTIVE CAPITAL STRUCTURE DEBT REFINANCING LOWERED ANNUAL CASH INTEREST BY $25M CAPITAL STRUCTURE PRO FORMA FOR REFINANCING COMPLETED IN JULY ($M) TOTAL DEBT(1) $467 CASH(1) $91 NET DEBT $376 DEBT TERMS ATTRACTIVE COST OF CAPITAL ($M) NEW FACILITY $480 (Term Loan B) MATURITY 2028 (7 year) PRICING 5.50%(0.75% LIBOR floor + 475bps) PREPAYMENT 102 hard call premium in year 1 Par thereafter DEBT / FY2022E ADJ. EBITDA(2) (GROSS / NET) 2.8X/2.3X 23 Notes: (1) Based on balance sheet as of July 31, 2021. Total debt outstanding reflects Original Issue Discount (“OID”). (2) Based on $165M, midpoint of FY2022E Adjusted EBITDA outlook range. |
|
24 Q&A 24 |

|
25 APPENDIX 25 |

|
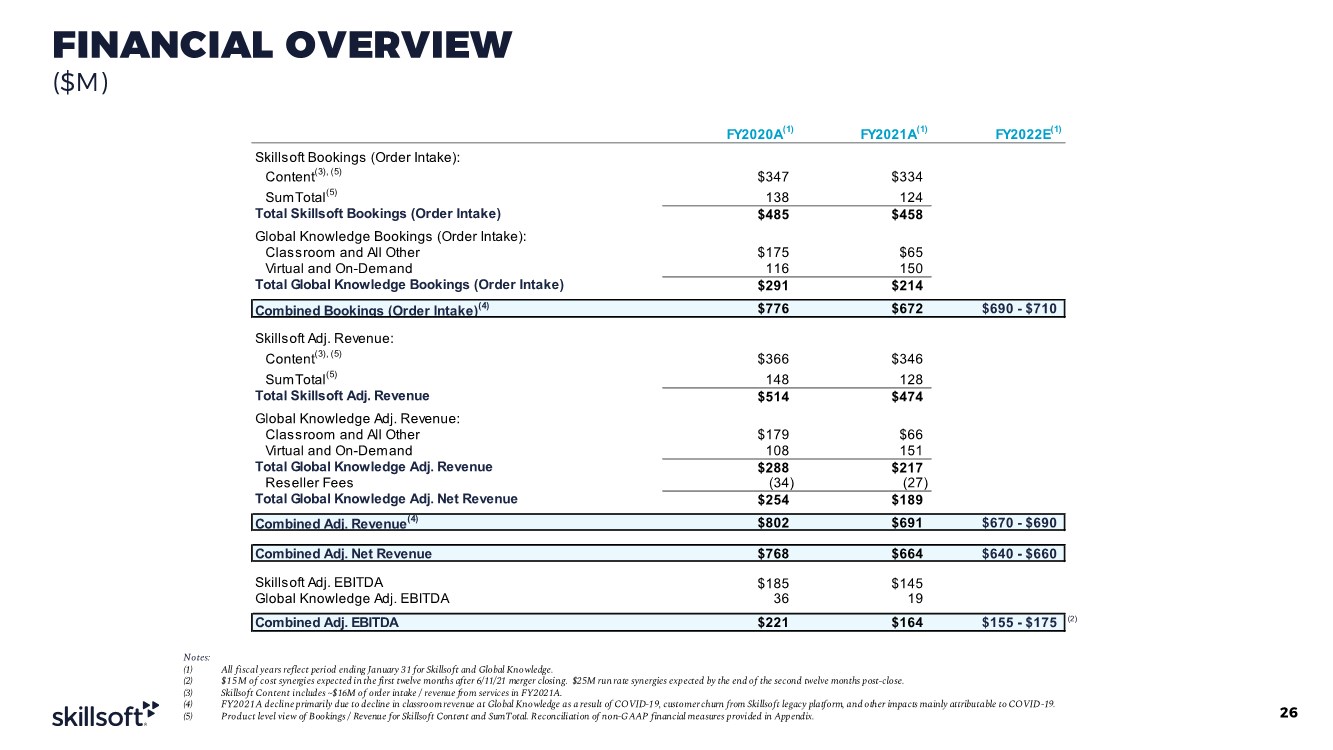
FINANCIAL OVERVIEW ($M) 26 Notes: (1) All fiscal years reflect period ending January 31 for Skillsoft and Global Knowledge. (2) $15M of cost synergies expected in the first twelve months after 6/11/21 merger closing. $25M run rate synergies expected by the end of the second twelve months post-close. (3) Skillsoft Content includes ~$16M of order intake / revenue from services in FY2021A. (4) FY2021A decline primarily due to decline in classroom revenue at Global Knowledge as a result of COVID-1 9, customer churn from Skillsoft legacy platform, and other impacts mainly attributable to COVID-19. (5) Product level view of Bookings / Revenue for Skillsoft Content and SumTotal. Reconciliation of non-GAAP financial measures provided in Appendix. FY2020A(1) FY2021A(1) FY2022E (1) Skillsoft Bookings (Order Intake): Content(3), (5) $347 $334 SumTotal(5) 138 124 Total Skillsoft Bookings (Order Intake) $485 $458 Global Knowledge Bookings (Order Intake): Classroom and All Other $175 $65 Virtual and On-Demand 116 150 Total Global Knowledge Bookings (Order Intake) $291 $214 Combined Bookings (Order Intake)(4) $776 $672 $690 - $710 Skillsoft Adj. Revenue: Content(3), (5) $366 $346 SumTotal(5) 148 128 Total Skillsoft Adj. Revenue $514 $474 Global Knowledge Adj. Revenue: Classroom and All Other $179 $66 Virtual and On-Demand 108 151 Total Global Knowledge Adj. Revenue $288 $217 Reseller Fees (34) (27) Total Global Knowledge Adj. Net Revenue $254 $189 Combined Adj. Revenue(4) $802 $691 $670 - $690 Combined Adj. Net Revenue $768 $664 $640 - $660 Skillsoft Adj. EBITDA $185 $145 Global Knowledge Adj. EBITDA 36 19 Combined Adj. EBITDA $221 $164 $155 - $175 (2) |
|
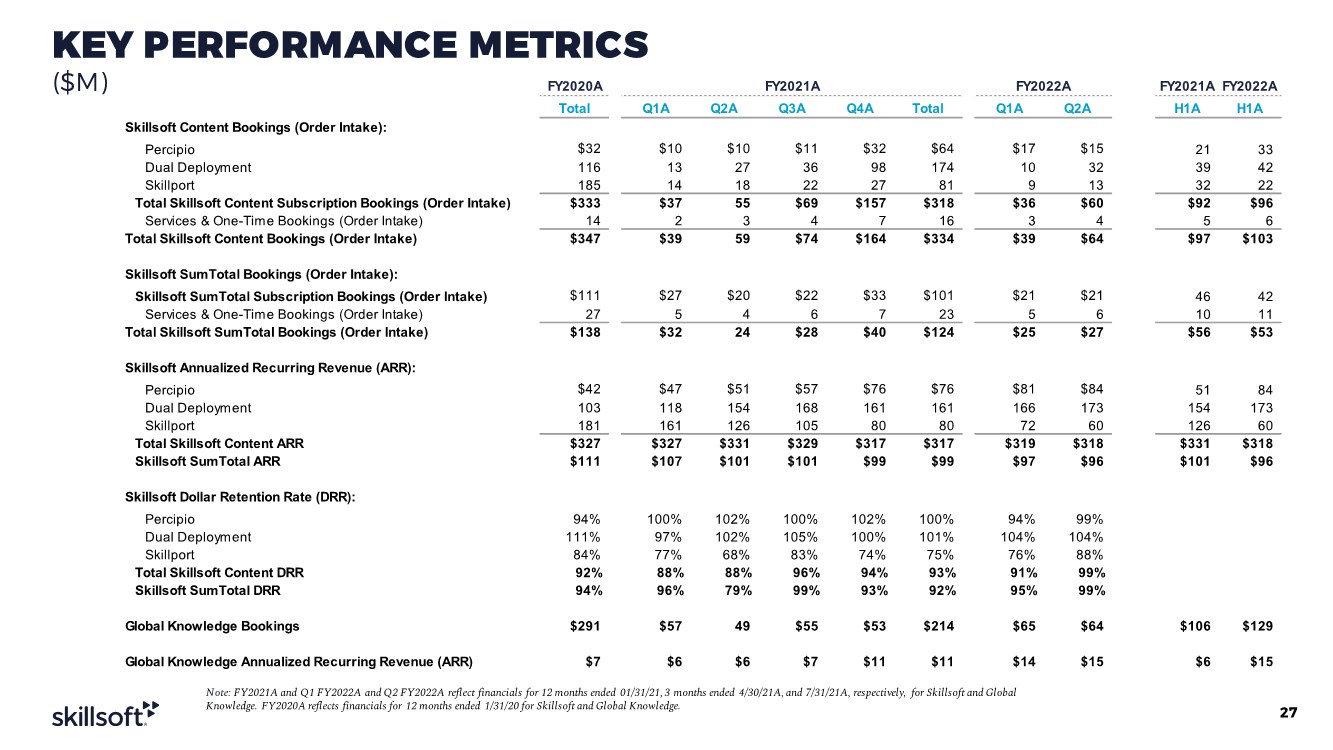
KEY PERFORMANCE METRICS ($M) 27 Note: FY2021A and Q1 FY2022A and Q2 FY2022A reflect financials for 12 months ended 01/31/21, 3 months ended 4/30/21A, and 7/31/21A, respectively, for Skillsoft and Global Knowledge. FY2020A reflects financials for 12 months ended 1/31/20 for Skillsoft and Global Knowledge. FY2020A FY2021A FY2022A FY2021A FY2022A Total Q1A Q2A Q3A Q4A Total Q1A Q2A H1A H1A Skillsoft Content Bookings (Order Intake): Percipio $32 $10 $10 $11 $32 $64 $17 $15 21 33 Dual Deployment 116 13 27 36 98 174 10 32 39 42 Skillport 185 14 18 22 27 81 9 13 32 22 Total Skillsoft Content Subscription Bookings (Order Intake) $333 $37 55 $69 $157 $318 $36 $60 $92 $96 Services & One-Time Bookings (Order Intake) 14 2 3 4 7 16 3 4 5 6 Total Skillsoft Content Bookings (Order Intake) $347 $39 59 $74 $164 $334 $39 $64 $97 $103 Skillsoft SumTotal Bookings (Order Intake): Skillsoft SumTotal Subscription Bookings (Order Intake) $111 $27 $20 $22 $33 $101 $21 $21 46 42 Services & One-Time Bookings (Order Intake) 27 5 4 6 7 23 5 6 10 11 Total Skillsoft SumTotal Bookings (Order Intake) $138 $32 24 $28 $40 $124 $25 $27 $56 $53 Skillsoft Annualized Recurring Revenue (ARR): Percipio $42 $47 $51 $57 $76 $76 $81 $84 51 84 Dual Deployment 103 118 154 168 161 161 166 173 154 173 Skillport 181 161 126 105 80 80 72 60 126 60 Total Skillsoft Content ARR $327 $327 $331 $329 $317 $317 $319 $318 $331 $318 Skillsoft SumTotal ARR $111 $107 $101 $101 $99 $99 $97 $96 $101 $96 Skillsoft Dollar Retention Rate (DRR): Percipio 94% 100% 102% 100% 102% 100% 94% 99% Dual Deployment 111% 97% 102% 105% 100% 101% 104% 104% Skillport 84% 77% 68% 83% 74% 75% 76% 88% Total Skillsoft Content DRR 92% 88% 88% 96% 94% 93% 91% 99% Skillsoft SumTotal DRR 94% 96% 79% 99% 93% 92% 95% 99% Global Knowledge Bookings $291 $57 49 $55 $53 $214 $65 $64 $106 $129 Global Knowledge Annualized Recurring Revenue (ARR) $7 $6 $6 $7 $11 $11 $14 $15 $6 $15 |
|
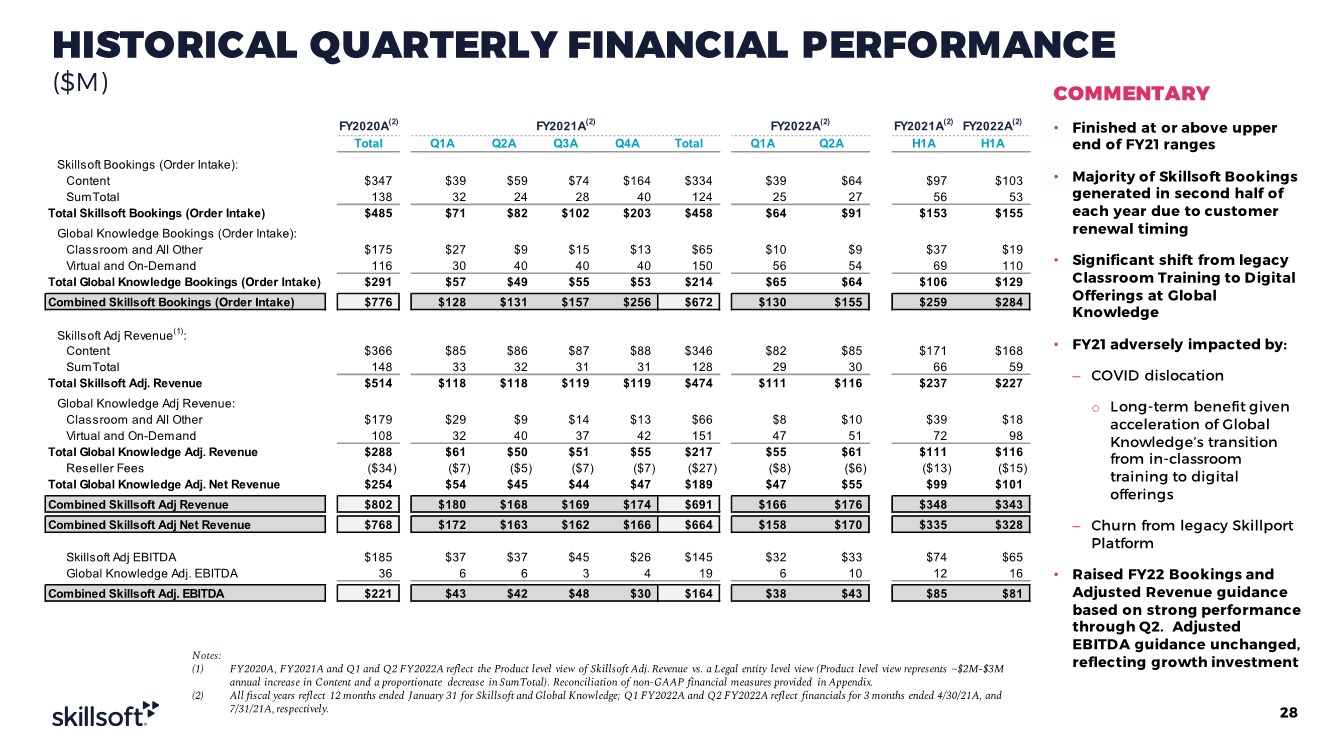
HISTORICAL QUARTERLY FINANCIAL PERFORMANCE ($M) COMMENTARY • Finished at or above upper end of FY21 ranges • Majority of Skillsoft Bookings generated in second half of each year due to customer renewal timing • Significant shift from legacy Classroom Training to Digital Offerings at Global Knowledge • FY21 adversely impacted by: ‒ COVID dislocation o Long-term benefit given acceleration of Global Knowledge’s transition from in-classroom training to digital offerings ‒ Churn from legacy Skillport Platform • Raised FY22 Bookings and Adjusted Revenue guidance based on strong performance through Q2. Adjusted EBITDA guidance unchanged, reflecting growth investment 28 Notes: (1) FY2020A, FY2021A and Q1 and Q2 FY2022A reflect the Product level view of Skillsoft Adj. Revenue vs. a Legal entity level view (Product level view represents ~$2M-$3M annual increase in Content and a proportionate decrease in SumTotal). Reconciliation of non-GAAP financial measures provided in Appendix. (2) All fiscal years reflect 12 months ended January 31 for Skillsoft and Global Knowledge; Q1 FY2022A and Q2 FY2022A reflect financials for 3 months ended 4/30/21A, and 7/31/21A, respectively. FY2020A(2) FY2021A(2) FY2022A(2) FY2021A(2) FY2022A(2) Total Q1A Q2A Q3A Q4A Total Q1A Q2A H1A H1A Skillsoft Bookings (Order Intake): Content $347 $39 $59 $74 $164 $334 $39 $64 $97 $103 SumTotal 138 32 24 28 40 124 25 27 56 53 Total Skillsoft Bookings (Order Intake) $485 $71 $82 $102 $203 $458 $64 $91 $153 $155 Global Knowledge Bookings (Order Intake): Classroom and All Other $175 $27 $9 $15 $13 $65 $10 $9 $37 $19 Virtual and On-Demand 116 30 40 40 40 150 56 54 69 110 Total Global Knowledge Bookings (Order Intake) $291 $57 $49 $55 $53 $214 $65 $64 $106 $129 Combined Skillsoft Bookings (Order Intake) $776 $128 $131 $157 $256 $672 $130 $155 $259 $284 Skillsoft Adj Revenue(1): Content $366 $85 $86 $87 $88 $346 $82 $85 $171 $168 SumTotal 148 33 32 31 31 128 29 30 66 59 Total Skillsoft Adj. Revenue $514 $118 $118 $119 $119 $474 $111 $116 $237 $227 Global Knowledge Adj Revenue: Classroom and All Other $179 $29 $9 $14 $13 $66 $8 $10 $39 $18 Virtual and On-Demand 108 32 40 37 42 151 47 51 72 98 Total Global Knowledge Adj. Revenue $288 $61 $50 $51 $55 $217 $55 $61 $111 $116 Reseller Fees ($34) ($7) ($5) ($7) ($7) ($27) ($8) ($6) ($13) ($15) Total Global Knowledge Adj. Net Revenue $254 $54 $45 $44 $47 $189 $47 $55 $99 $101 Combined Skillsoft Adj Revenue $802 $180 $168 $169 $174 $691 $166 $176 $348 $343 Combined Skillsoft Adj Net Revenue $768 $172 $163 $162 $166 $664 $158 $170 $335 $328 Skillsoft Adj EBITDA $185 $37 $37 $45 $26 $145 $32 $33 $74 $65 Global Knowledge Adj. EBITDA 36 6 6 3 4 19 6 10 12 16 Combined Skillsoft Adj. EBITDA $221 $43 $42 $48 $30 $164 $38 $43 $85 $81 |
|
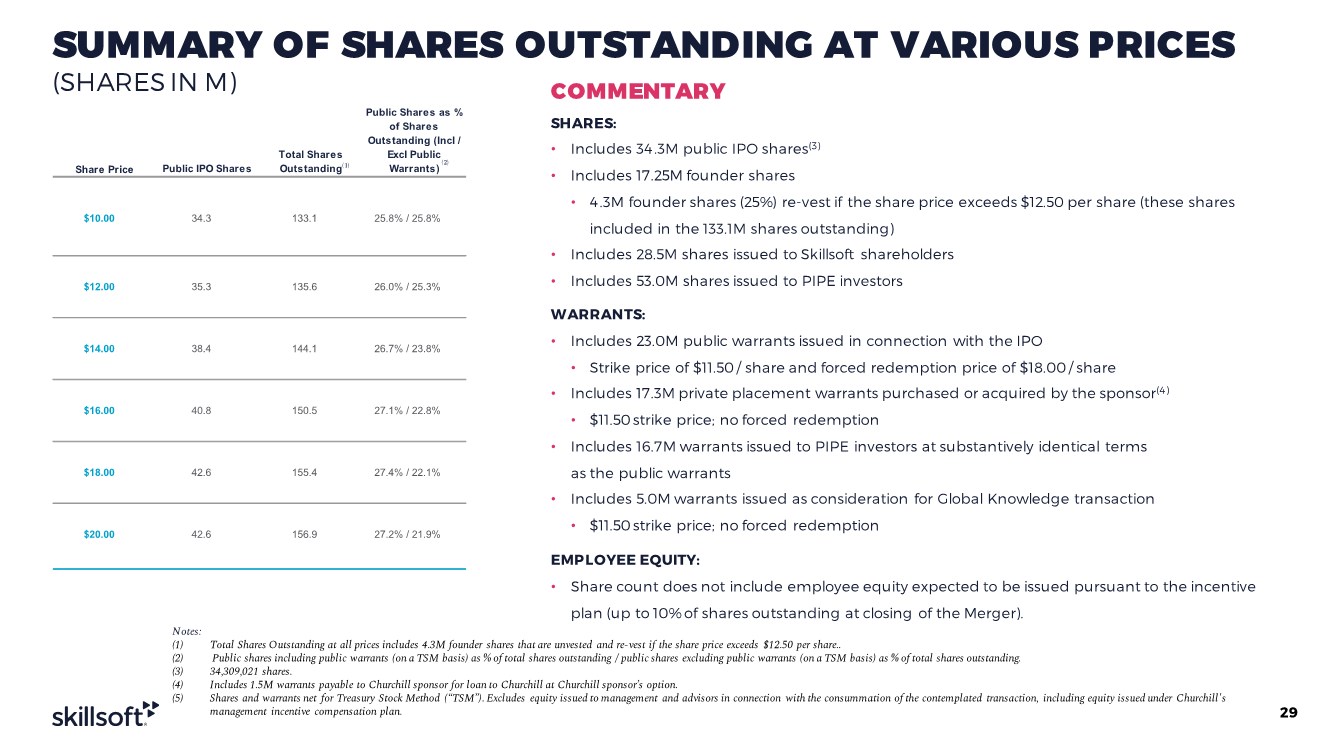
Share Price Public IPO Shares Total Shares Outstanding Public Shares as % of Shares Outstanding (Incl / Excl Public Warrants) $10.00 34.3 133.1 25.8% / 25.8% $12.00 35.3 135.6 26.0% / 25.3% $14.00 38.4 144.1 26.7% / 23.8% $16.00 40.8 150.5 27.1% / 22.8% $18.00 42.6 155.4 27.4% / 22.1% $20.00 42.6 156.9 27.2% / 21.9% SUMMARY OF SHARES OUTSTANDING AT VARIOUS PRICES (SHARES IN M) SHARES: • Includes 34.3M public IPO shares(3) • Includes 17.25M founder shares • 4.3M founder shares (25%) re-vest if the share price exceeds $12.50 per share (these shares included in the 133.1M shares outstanding) • Includes 28.5M shares issued to Skillsoft shareholders • Includes 53.0M shares issued to PIPE investors WARRANTS: • Includes 23.0M public warrants issued in connection with the IPO • Strike price of $11.50 / share and forced redemption price of $18.00 / share • Includes 17.3M private placement warrants purchased or acquired by the sponsor(4) • $11.50 strike price; no forced redemption • Includes 16.7M warrants issued to PIPE investors at substantively identical terms as the public warrants • Includes 5.0M warrants issued as consideration for Global Knowledge transaction • $11.50 strike price; no forced redemption EMPLOYEE EQUITY: • Share count does not include employee equity expected to be issued pursuant to the incentive plan (up to 10% of shares outstanding at closing of the Merger). (2) COMMENTARY (1) 29 Notes: (1) Total Shares Outstanding at all prices includes 4.3M founder shares that are unvested and re-vest if the share price exceeds $12.50 per share.. (2) Public shares including public warrants (on a TSM basis) as % of total shares outstanding / public shares excluding public warrants (on a TSM basis) as % of total shares outstanding. (3) 34,309,021 shares. (4) Includes 1.5M warrants payable to Churchill sponsor for loan to Churchill at Churchill sponsor’s option. (5) Shares and warrants net for Treasury Stock Method (“TSM”). Excludes equity issued to management and advisors in connection with the consummation of the contemplated transaction, including equity issued under Churchill's management incentive compensation plan. |
|
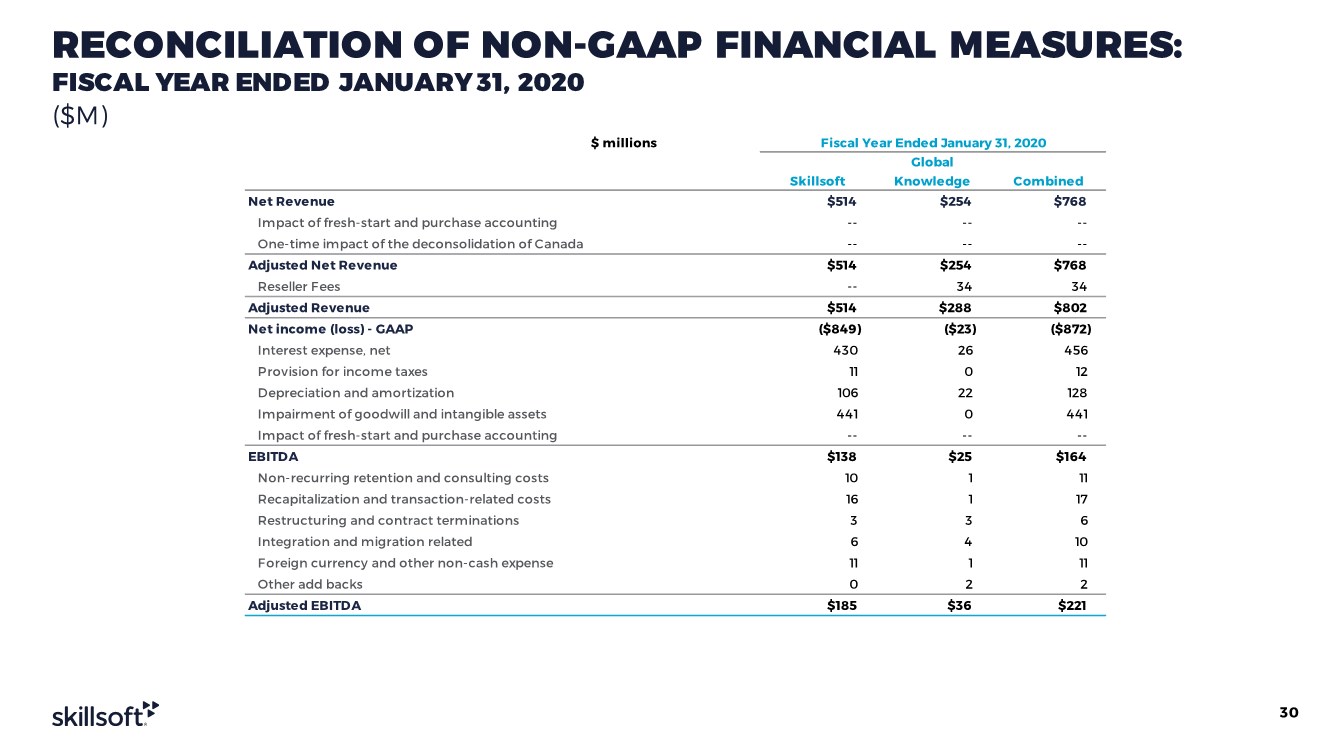
RECONCILIATION OF NON-GAAP FINANCIAL MEASURES: FISCAL YEAR ENDED JANUARY 31, 2020 ($M) 30 $ millions Fiscal Year Ended January 31, 2020 Skillsoft Global Knowledge Combined Net Revenue $514 $254 $768 Impact of fresh-start and purchase accounting -- -- -- One-time impact of the deconsolidation of Canada -- -- -- Adjusted Net Revenue $514 $254 $768 Reseller Fees -- 34 34 Adjusted Revenue $514 $288 $802 Net income (loss) - GAAP ($849) ($23) ($872) Interest expense, net 430 26 456 Provision for income taxes 11 0 12 Depreciation and amortization 106 22 128 Impairment of goodwill and intangible assets 441 0 441 Impact of fresh-start and purchase accounting -- -- -- EBITDA $138 $25 $164 Non-recurring retention and consulting costs 10 1 11 Recapitalization and transaction-related costs 16 1 17 Restructuring and contract terminations 3 3 6 Integration and migration related 6 4 10 Foreign currency and other non-cash expense 11 1 11 Other add backs 0 2 2 Adjusted EBITDA $185 $36 $221 |
|
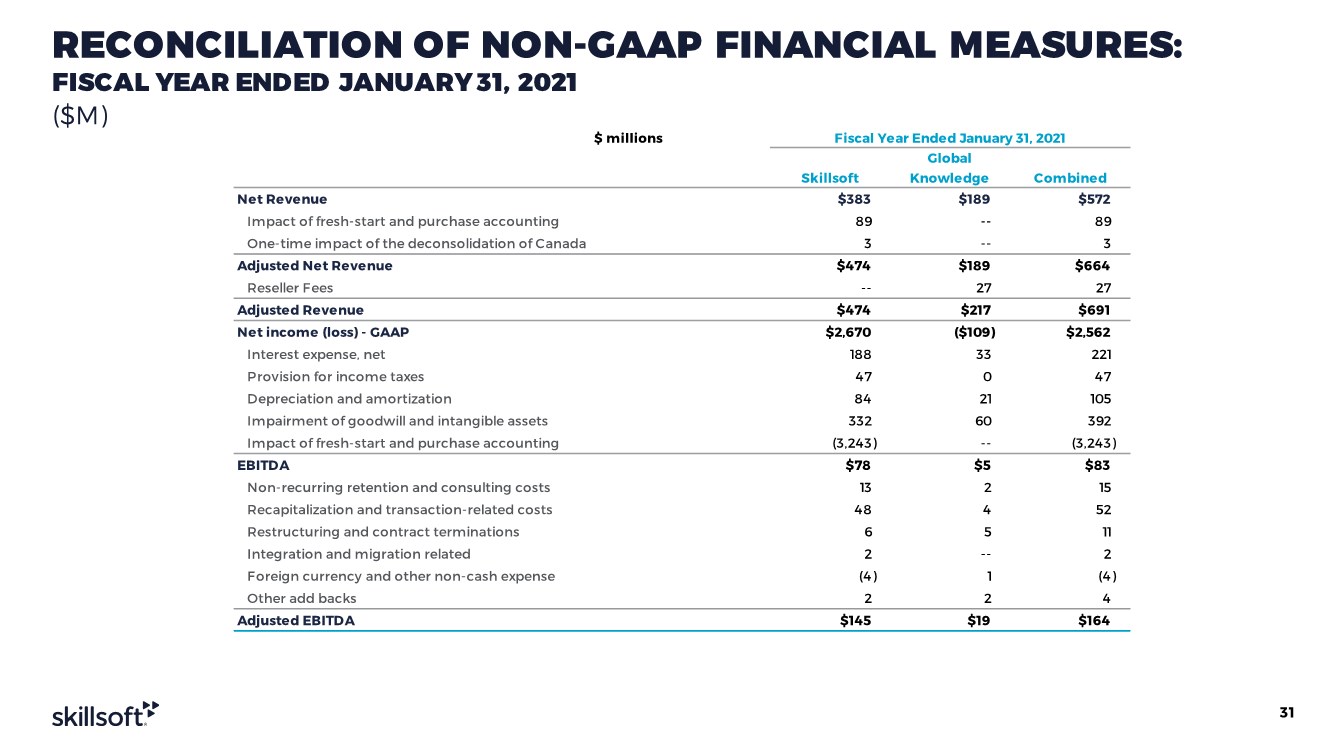
RECONCILIATION OF NON-GAAP FINANCIAL MEASURES: FISCAL YEAR ENDED JANUARY 31, 2021 ($M) 31 $ millions Fiscal Year Ended January 31, 2021 Skillsoft Global Knowledge Combined Net Revenue $383 $189 $572 Impact of fresh-start and purchase accounting 89 -- 89 One-time impact of the deconsolidation of Canada 3 -- 3 Adjusted Net Revenue $474 $189 $664 Reseller Fees -- 27 27 Adjusted Revenue $474 $217 $691 Net income (loss) - GAAP $2,670 ($109) $2,562 Interest expense, net 188 33 221 Provision for income taxes 47 0 47 Depreciation and amortization 84 21 105 Impairment of goodwill and intangible assets 332 60 392 Impact of fresh-start and purchase accounting (3,243) -- (3,243) EBITDA $78 $5 $83 Non-recurring retention and consulting costs 13 2 15 Recapitalization and transaction-related costs 48 4 52 Restructuring and contract terminations 6 5 11 Integration and migration related 2 -- 2 Foreign currency and other non-cash expense (4) 1 (4) Other add backs 2 2 4 Adjusted EBITDA $145 $19 $164 |
|
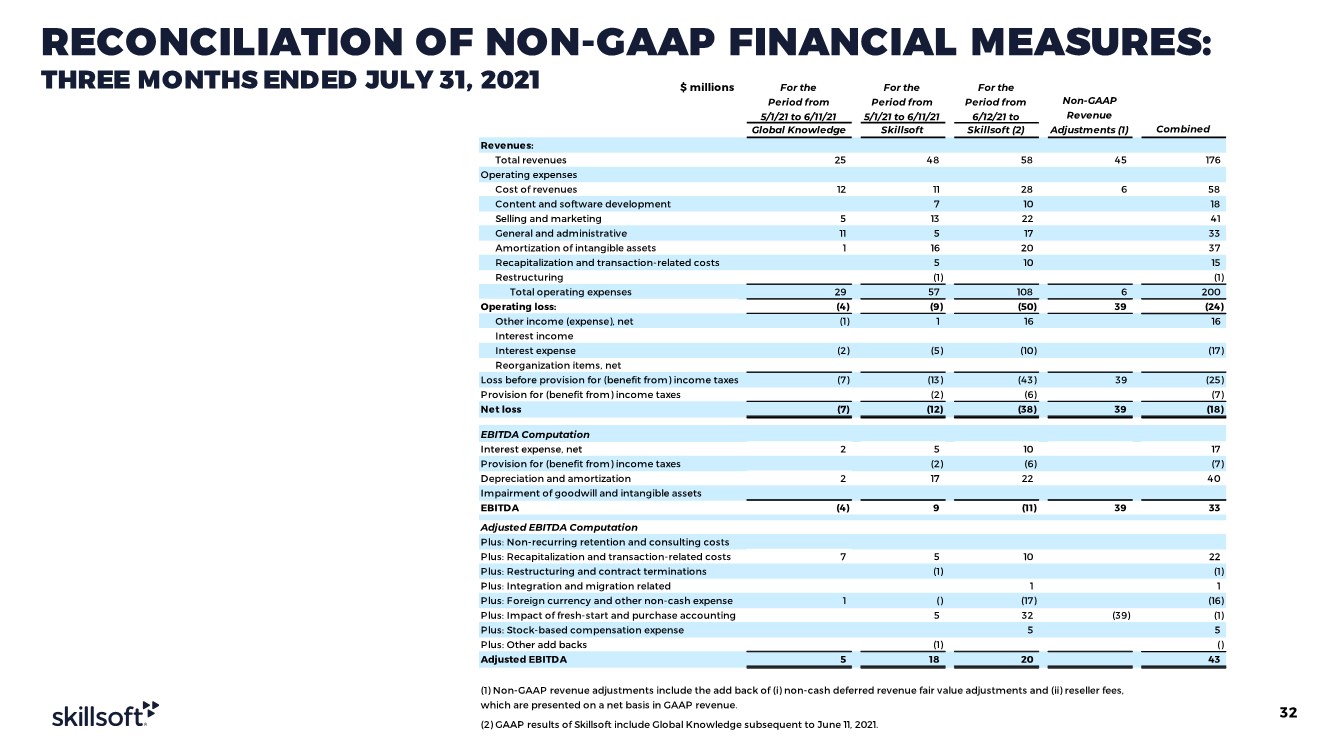
RECONCILIATION OF NON-GAAP FINANCIAL MEASURES: THREE MONTHS ENDED JULY 31, 2021 32 $ millions Global Knowledge Skillsoft Skillsoft (2) Combined Revenues: Total revenues 25 48 58 45 176 Operating expenses Cost of revenues 12 11 28 6 58 Content and software development 7 10 18 Selling and marketing 5 13 22 41 General and administrative 11 5 17 33 Amortization of intangible assets 1 16 20 37 Recapitalization and transaction-related costs 5 10 15 Restructuring (1) (1) Total operating expenses 29 57 108 6 200 Operating loss: (4) (9) (50) 39 (24) Other income (expense), net (1) 1 16 16 Interest income Interest expense (2) (5) (10) (17) Reorganization items, net Loss before provision for (benefit from) income taxes (7) (13) (43) 39 (25) Provision for (benefit from) income taxes (2) (6) (7) Net loss (7) (12) (38) 39 (18) EBITDA Computation Interest expense, net 2 5 10 17 Provision for (benefit from) income taxes (2) (6) (7) Depreciation and amortization 2 17 22 40 Impairment of goodwill and intangible assets EBITDA (4) 9 (11) 39 33 Adjusted EBITDA Computation Plus: Non-recurring retention and consulting costs Plus: Recapitalization and transaction-related costs 7 5 10 22 Plus: Restructuring and contract terminations (1) (1) Plus: Integration and migration related 1 1 Plus: Foreign currency and other non-cash expense 1 () (17) (16) Plus: Impact of fresh-start and purchase accounting 5 32 (39) (1) Plus: Stock-based compensation expense 5 5 Plus: Other add backs (1) () Adjusted EBITDA 5 18 20 43 (1) Non-GAAP revenue adjustments include the add back of (i) non-cash deferred revenue fair value adjustments and (ii) reseller fees, which are presented on a net basis in GAAP revenue. (2) GAAP results of Skillsoft include Global Knowledge subsequent to June 11, 2021. Non-GAAP Revenue Adjustments (1) For the Period from 5/1/21 to 6/11/21 For the Period from 5/1/21 to 6/11/21 For the Period from 6/12/21 to |
|
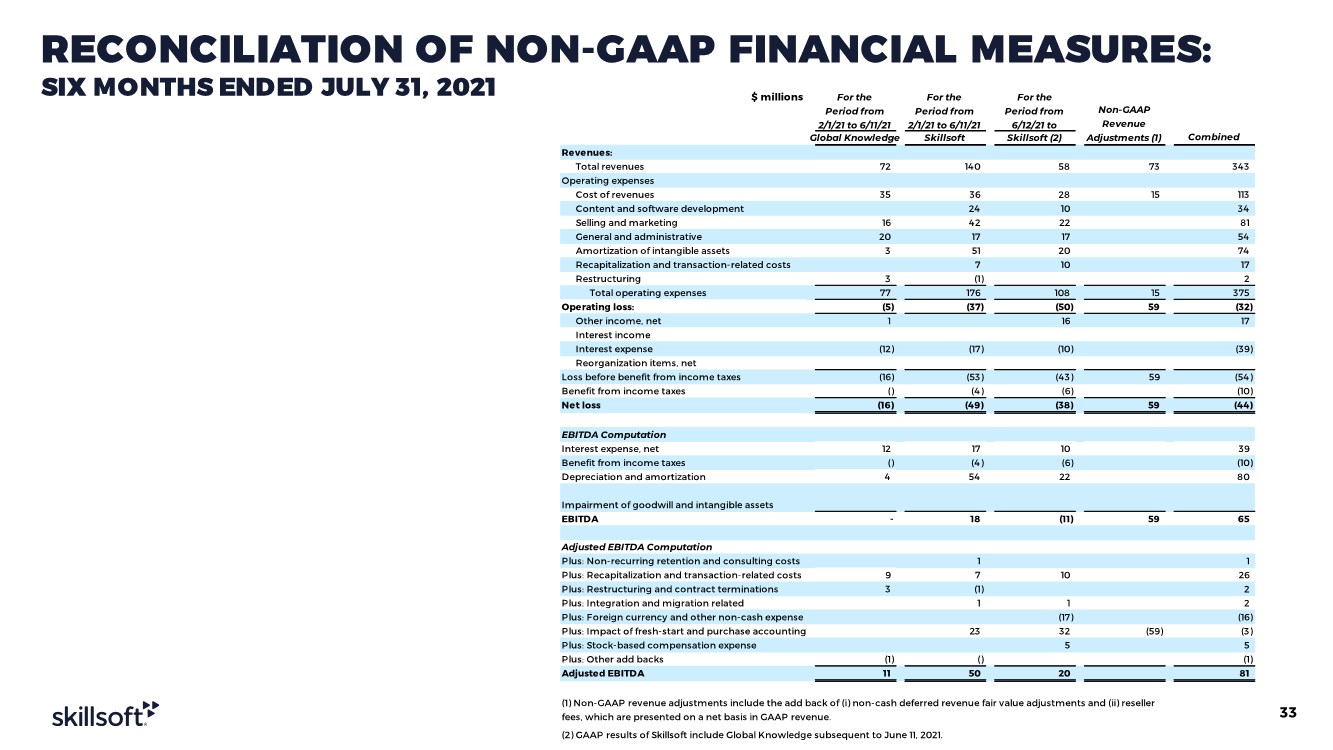
RECONCILIATION OF NON-GAAP FINANCIAL MEASURES: SIX MONTHS ENDED JULY 31, 2021 33 $ millions Global Knowledge Skillsoft Skillsoft (2) Combined Revenues: Total revenues 72 140 58 73 343 Operating expenses Cost of revenues 35 36 28 15 113 Content and software development 24 10 34 Selling and marketing 16 42 22 81 General and administrative 20 17 17 54 Amortization of intangible assets 3 51 20 74 Recapitalization and transaction-related costs 7 10 17 Restructuring 3 (1) 2 Total operating expenses 77 176 108 15 375 Operating loss: (5) (37) (50) 59 (32) Other income, net 1 16 17 Interest income Interest expense (12) (17) (10) (39) Reorganization items, net Loss before benefit from income taxes (16) (53) (43) 59 (54) Benefit from income taxes () (4) (6) (10) Net loss (16) (49) (38) 59 (44) EBITDA Computation Interest expense, net 12 17 10 39 Benefit from income taxes () (4) (6) (10) Depreciation and amortization 4 54 22 80 Impairment of goodwill and intangible assets EBITDA - 18 (11) 59 65 Adjusted EBITDA Computation Plus: Non-recurring retention and consulting costs 1 1 Plus: Recapitalization and transaction-related costs 9 7 10 26 Plus: Restructuring and contract terminations 3 (1) 2 Plus: Integration and migration related 1 1 2 Plus: Foreign currency and other non-cash expense (17) (16) Plus: Impact of fresh-start and purchase accounting 23 32 (59) (3) Plus: Stock-based compensation expense 5 5 Plus: Other add backs (1) () (1) Adjusted EBITDA 11 50 20 81 (1) Non-GAAP revenue adjustments include the add back of (i) non-cash deferred revenue fair value adjustments and (ii) reseller fees, which are presented on a net basis in GAAP revenue. (2) GAAP results of Skillsoft include Global Knowledge subsequent to June 11, 2021. For the Period from 2/1/21 to 6/11/21 For the Period from 2/1/21 to 6/11/21 For the Period from 6/12/21 to Non-GAAP Revenue Adjustments (1) |
|
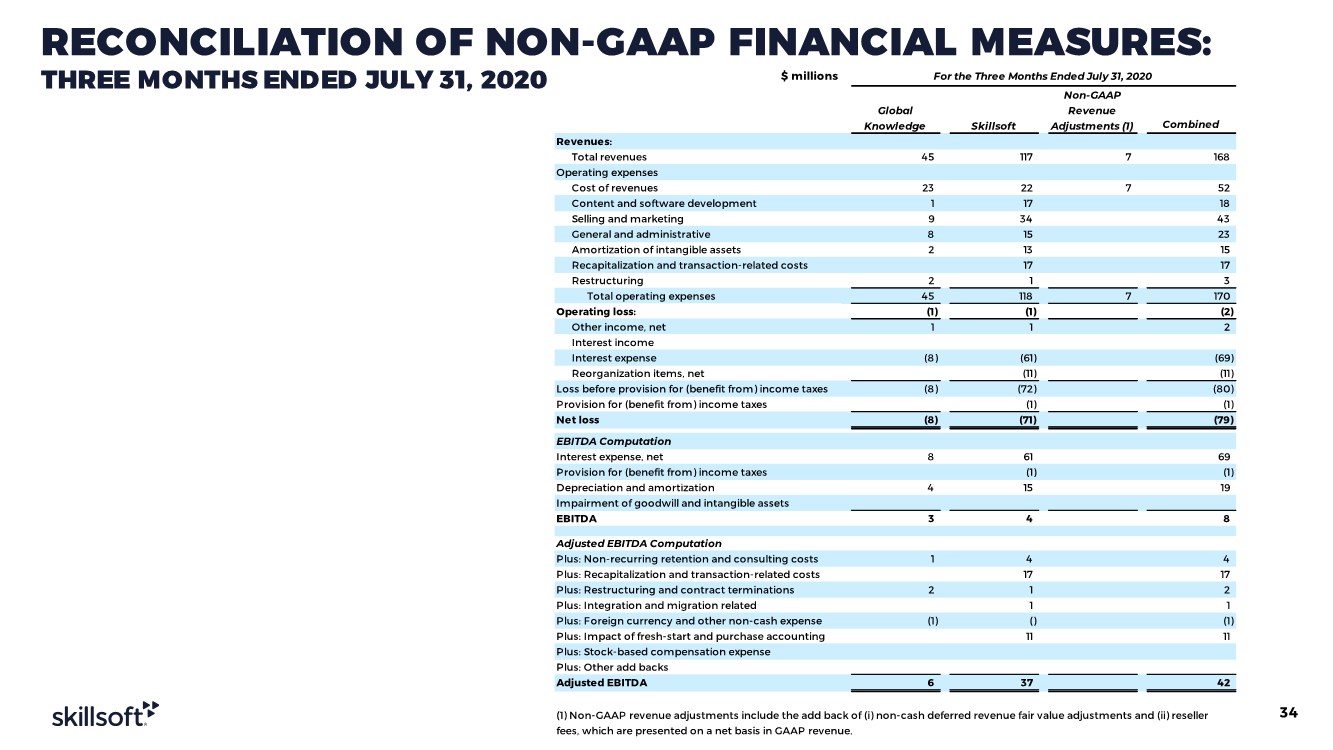
RECONCILIATION OF NON-GAAP FINANCIAL MEASURES: THREE MONTHS ENDED JULY 31, 2020 34 $ millions Combined Revenues: Total revenues 45 117 7 168 Operating expenses Cost of revenues 23 22 7 52 Content and software development 1 17 18 Selling and marketing 9 34 43 General and administrative 8 15 23 Amortization of intangible assets 2 13 15 Recapitalization and transaction-related costs 17 17 Restructuring 2 1 3 Total operating expenses 45 118 7 170 Operating loss: (1) (1) (2) Other income, net 1 1 2 Interest income Interest expense (8) (61) (69) Reorganization items, net (11) (11) Loss before provision for (benefit from) income taxes (8) (72) (80) Provision for (benefit from) income taxes (1) (1) Net loss (8) (71) (79) EBITDA Computation Interest expense, net 8 61 69 Provision for (benefit from) income taxes (1) (1) Depreciation and amortization 4 15 19 Impairment of goodwill and intangible assets EBITDA 3 4 8 Adjusted EBITDA Computation Plus: Non-recurring retention and consulting costs 1 4 4 Plus: Recapitalization and transaction-related costs 17 17 Plus: Restructuring and contract terminations 2 1 2 Plus: Integration and migration related 1 1 Plus: Foreign currency and other non-cash expense (1) () (1) Plus: Impact of fresh-start and purchase accounting 11 11 Plus: Stock-based compensation expense Plus: Other add backs Adjusted EBITDA 6 37 42 For the Three Months Ended July 31, 2020 Non-GAAP Revenue Adjustments (1) Global Knowledge Skillsoft (1) Non-GAAP revenue adjustments include the add back of (i) non-cash deferred revenue fair value adjustments and (ii) reseller fees, which are presented on a net basis in GAAP revenue. |
|
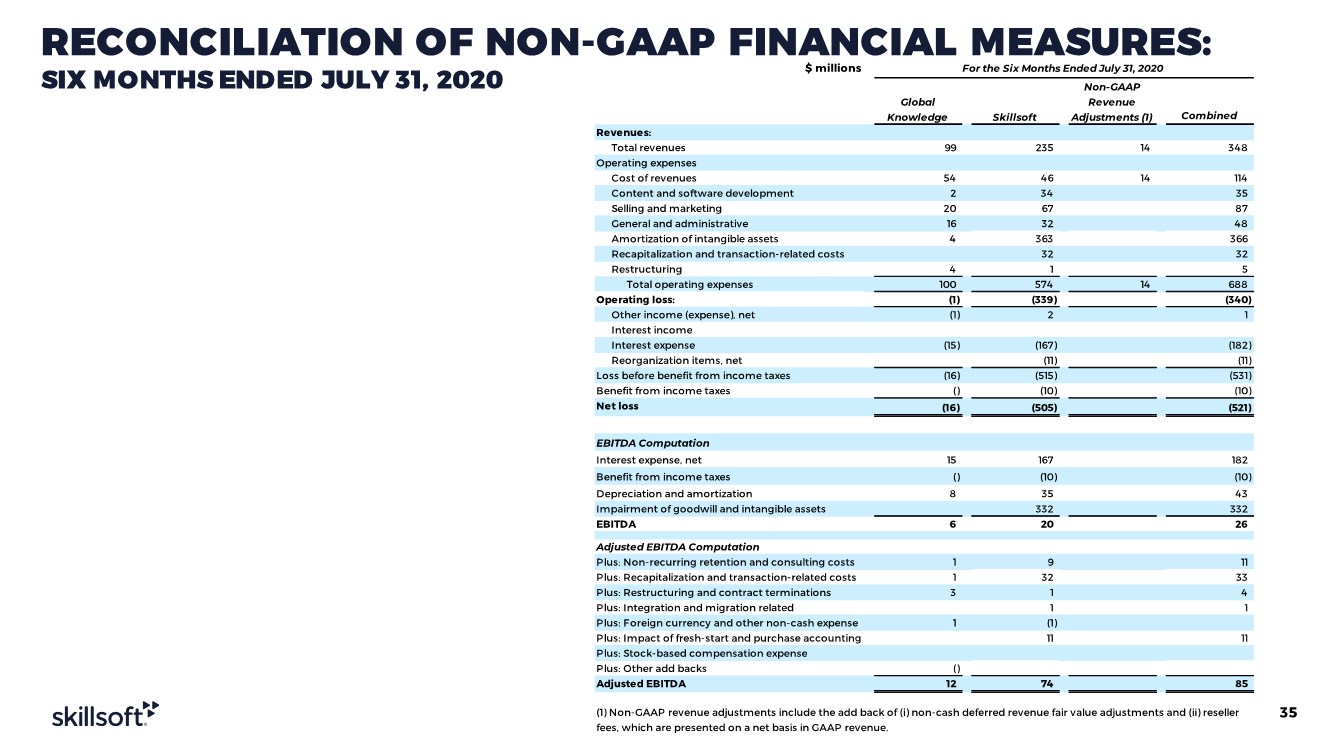
RECONCILIATION OF NON-GAAP FINANCIAL MEASURES: SIX MONTHS ENDED JULY 31, 2020 35 $ millions Combined Revenues: Total revenues 99 235 14 348 Operating expenses Cost of revenues 54 46 14 114 Content and software development 2 34 35 Selling and marketing 20 67 87 General and administrative 16 32 48 Amortization of intangible assets 4 363 366 Recapitalization and transaction-related costs 32 32 Restructuring 4 1 5 Total operating expenses 100 574 14 688 Operating loss: (1) (339) (340) Other income (expense), net (1) 2 1 Interest income Interest expense (15) (167) (182) Reorganization items, net (11) (11) Loss before benefit from income taxes (16) (515) (531) Benefit from income taxes () (10) (10) Net loss (16) (505) (521) EBITDA Computation Interest expense, net 15 167 182 Benefit from income taxes () (10) (10) Depreciation and amortization 8 35 43 Impairment of goodwill and intangible assets 332 332 EBITDA 6 20 26 Adjusted EBITDA Computation Plus: Non-recurring retention and consulting costs 1 9 11 Plus: Recapitalization and transaction-related costs 1 32 33 Plus: Restructuring and contract terminations 3 1 4 Plus: Integration and migration related 1 1 Plus: Foreign currency and other non-cash expense 1 (1) Plus: Impact of fresh-start and purchase accounting 11 11 Plus: Stock-based compensation expense Plus: Other add backs () Adjusted EBITDA 12 74 85 (1) Non-GAAP revenue adjustments include the add back of (i) non-cash deferred revenue fair value adjustments and (ii) reseller fees, which are presented on a net basis in GAAP revenue. Non-GAAP Revenue Adjustments (1) Global Knowledge Skillsoft For the Six Months Ended July 31, 2020 |
|
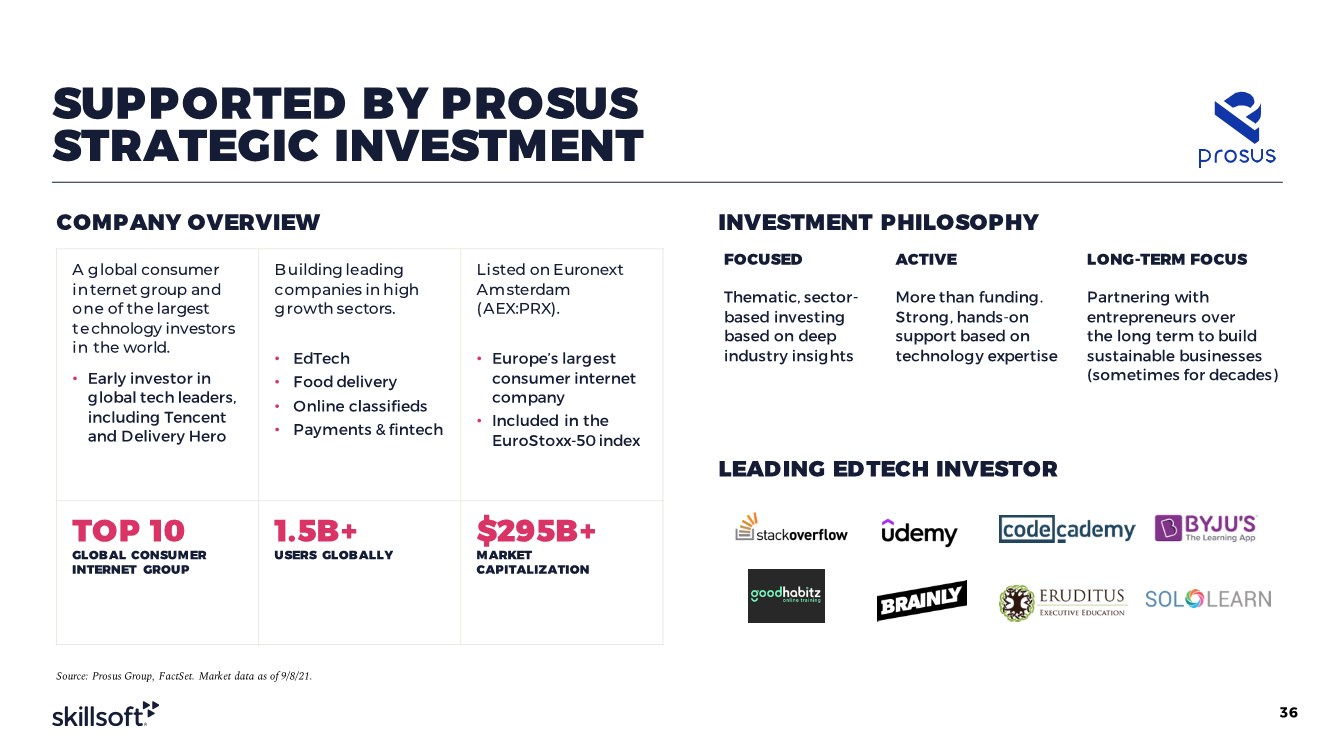
A global consumer in ternet group and one of the largest te chnology investors i n the world. • Early investor in global tech leaders, including Tencent and Delivery Hero Building leading companies in high g rowth sectors. • EdTech • Food delivery • Online classifieds • Payments & fintech Listed on Euronext Am sterdam (AEX:PRX). • Europe’s largest consumer internet company • Included in the EuroStoxx-50 index TOP 10 GLOBAL CONSUMER INTERNET GROUP 1.5B+ USERS GLOBALLY $295B+ M ARKET CAPITALIZATION INVESTMENT PHILOSOPHY FOCUSED ACTIVE LONG-TERM FOCUS Thematic, sector- based investing based on deep industry insights More than funding. Strong, hands-on support based on technology expertise Partnering with entrepreneurs over the long term to build sustainable businesses (sometimes for decades) SUPPORTED BY PROSUS STRATEGIC INVESTMENT Source: Prosus Group, FactSet. Market data as of 9/8/21. COMPANY OVERVIEW LEAD ING ED TECH INVESTOR 36 |
|
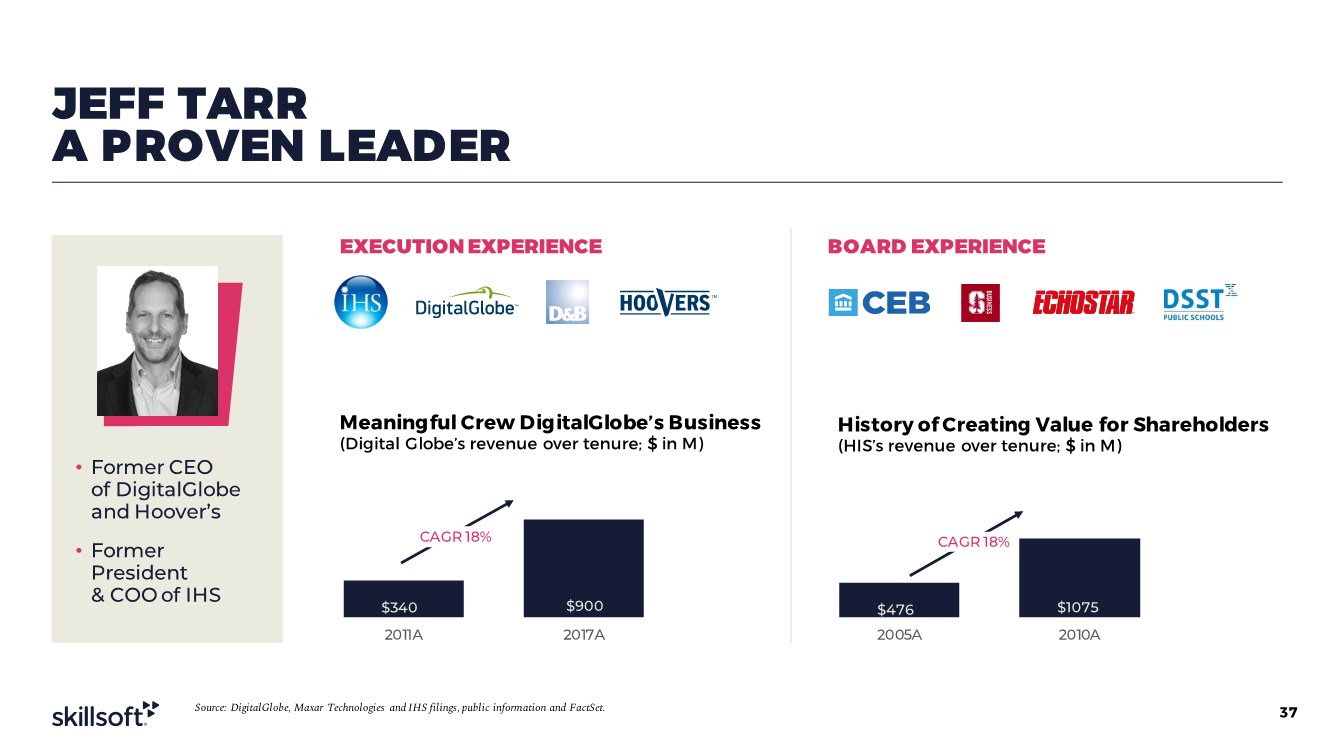
JEFF TARR A PROVEN LEADER 37 $476 $1075 2005A 2010A $340 $900 2011A 2017A • Former CEO of DigitalGlobe and Hoover’s • Former President & COO of IHS CAGR 18% CAGR 18% Source: DigitalGlobe, Maxar Technologies and IHS filings, public information and FactSet. Meaningful Crew DigitalGlobe’s Business (Digital Globe’s revenue over tenure; $ in M) History of Creating Value for Shareholders (HIS’s revenue over tenure; $ in M) EXECUTION EXPERIENCE BOARD EXPERIENCE |
|
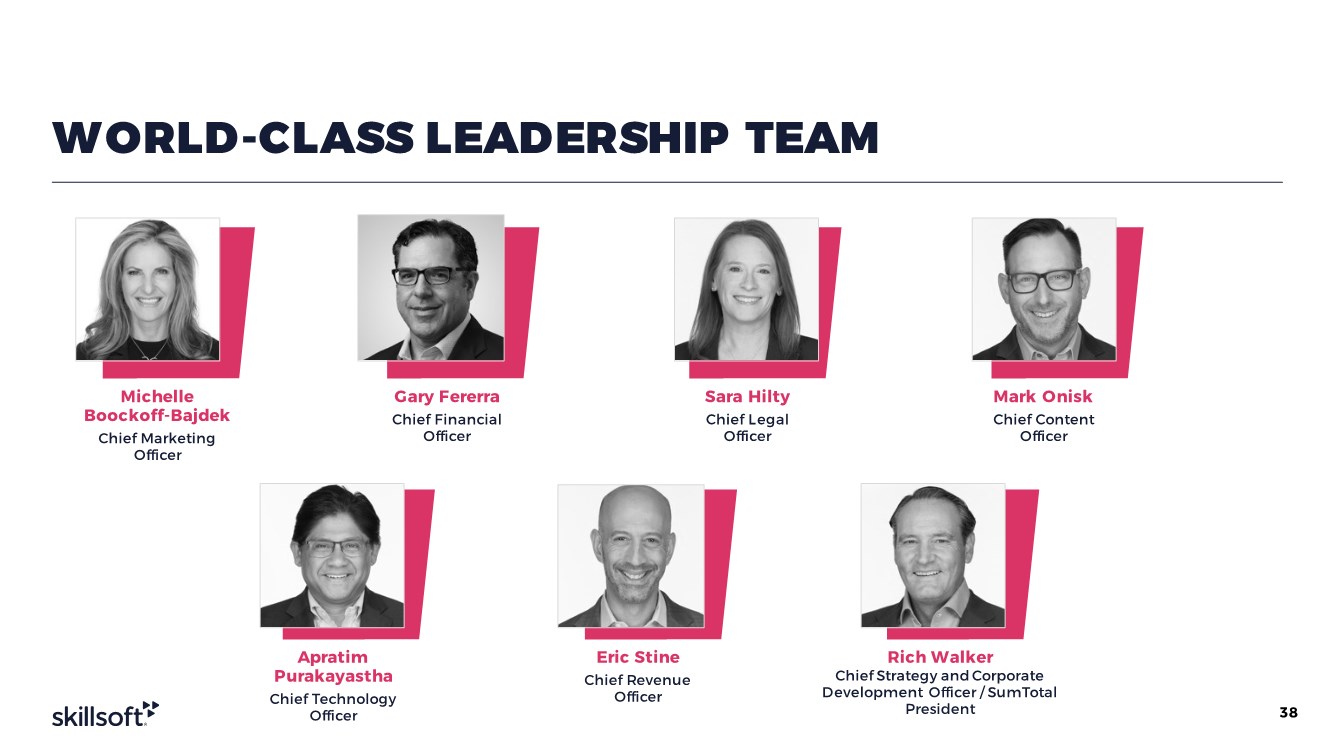
WORLD-CLASS LEADERSHIP TEAM 38 Michelle Boockoff-Bajdek Chief Marketing Officer Gary Fererra Chief Financial Officer Sara Hilty Chief Legal Officer Mark Onisk Chief Content Officer Apratim Purakayastha Chief Technology Officer Eric Stine Chief Revenue Officer Rich Walker Chief Strategy andCorporate Development Officer / SumTotal President |